

53
As with water, ozone is commonly sourced externally from sensors such as
NASA’s Total Ozone Mapping Spectrometer (TOMS; 1978–2005) and ESA’s
Global Ozone Monitoring Experiment (GOME; 1996 to 2011). The Ozone
Monitoring Instrument (OMI) has continued the time series of TOMS data since
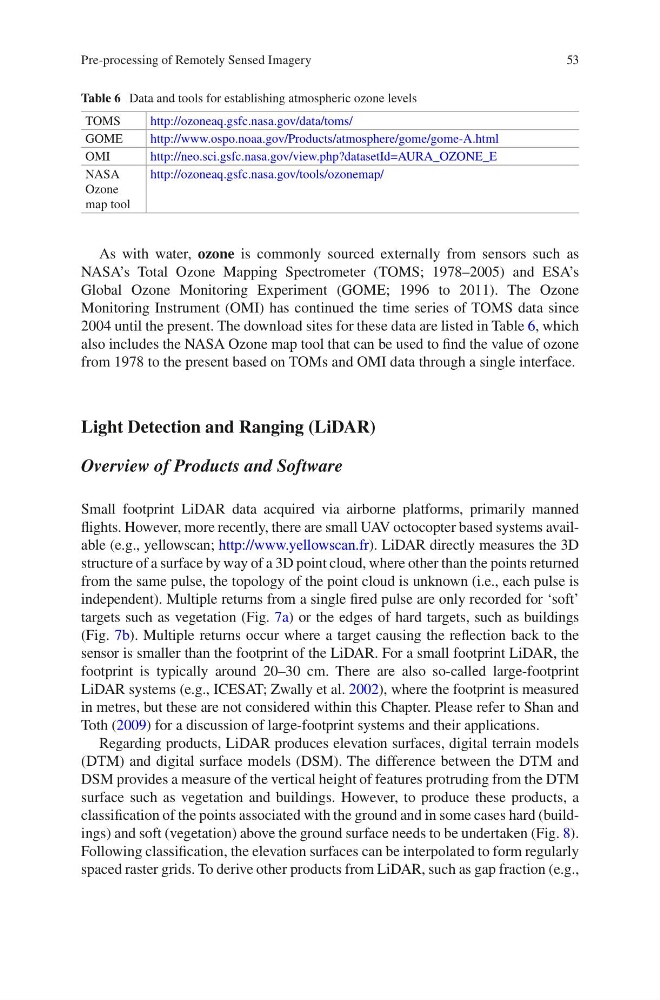
2004 until the present. The download sites for these data are listed in Table 6, which
also includes the NASA Ozone map tool that can be used to find the value of ozone
from 1978 to the present based on TOMs and OMI data through a single interface.
Light Detection and Ranging (LiDAR)
Overview of Products and Software
Small footprint LiDAR data acquired via airborne platforms, primarily manned
flights. However, more recently, there are small UAV octocopter based systems available (e.g., yellowscan; http://www.yellowscan.fr). LiDAR directly measures the 3D
structure of a surface by way of a 3D point cloud, where other than the points returned
from the same pulse, the topology of the point cloud is unknown (i.e., each pulse is
independent). Multiple returns from a single fired pulse are only recorded for ‘soft’
targets such as vegetation (Fig. 7a) or the edges of hard targets, such as buildings
(Fig. 7b). Multiple returns occur where a target causing the reflection back to the
sensor is smaller than the footprint of the LiDAR. For a small footprint LiDAR, the
footprint is typically around 20–30 cm. There are also so-called large- footprint
LiDAR systems (e.g., ICESAT; Zwally et al. 2002), where the footprint is measured
in metres, but these are not considered within this Chapter. Please refer to Shan and
Toth (2009) for a discussion of large-footprint systems and their applications.
Regarding products, LiDAR produces elevation surfaces, digital terrain models
(DTM) and digital surface models (DSM). The difference between the DTM and
DSM provides a measure of the vertical height of features protruding from the DTM
surface such as vegetation and buildings. However, to produce these products, a
classification of the points associated with the ground and in some cases hard (buildings) and soft (vegetation) above the ground surface needs to be undertaken (Fig. 8).
Following classification, the elevation surfaces can be interpolated to form regularly
spaced raster grids. To derive other products from LiDAR, such as gap fraction (e.g.,
Table 6 Data and tools for establishing atmospheric ozone levels
TOMS
http://ozoneaq.gsfc.nasa.gov/data/toms/
GOME
http://www.ospo.noaa.gov/Products/atmosphere/gome/gome-A.html
OMI
http://neo.sci.gsfc.nasa.gov/view.php?datasetId=AURA_OZONE_E
NASA
Ozone
map tool
http://ozoneaq.gsfc.nasa.gov/tools/ozonemap/
Pre-processing of Remotely Sensed Imagery
As with water, ozone is commonly sourced externally from sensors such as
NASA’s Total Ozone Mapping Spectrometer (TOMS; 1978–2005) and ESA’s
Global Ozone Monitoring Experiment (GOME; 1996 to 2011). The Ozone
Monitoring Instrument (OMI) has continued the time series of TOMS data since
2004 until the present. The download sites for these data are listed in Table 6, which
also includes the NASA Ozone map tool that can be used to find the value of ozone
from 1978 to the present based on TOMs and OMI data through a single interface.
Light Detection and Ranging (LiDAR)
Overview of Products and Software
Small footprint LiDAR data acquired via airborne platforms, primarily manned
flights. However, more recently, there are small UAV octocopter based systems available (e.g., yellowscan; http://www.yellowscan.fr). LiDAR directly measures the 3D
structure of a surface by way of a 3D point cloud, where other than the points returned
from the same pulse, the topology of the point cloud is unknown (i.e., each pulse is
independent). Multiple returns from a single fired pulse are only recorded for ‘soft’
targets such as vegetation (Fig. 7a) or the edges of hard targets, such as buildings
(Fig. 7b). Multiple returns occur where a target causing the reflection back to the
sensor is smaller than the footprint of the LiDAR. For a small footprint LiDAR, the
footprint is typically around 20–30 cm. There are also so-called large- footprint
LiDAR systems (e.g., ICESAT; Zwally et al. 2002), where the footprint is measured
in metres, but these are not considered within this Chapter. Please refer to Shan and
Toth (2009) for a discussion of large-footprint systems and their applications.
Regarding products, LiDAR produces elevation surfaces, digital terrain models
(DTM) and digital surface models (DSM). The difference between the DTM and
DSM provides a measure of the vertical height of features protruding from the DTM
surface such as vegetation and buildings. However, to produce these products, a
classification of the points associated with the ground and in some cases hard (buildings) and soft (vegetation) above the ground surface needs to be undertaken (Fig. 8).
Following classification, the elevation surfaces can be interpolated to form regularly
spaced raster grids. To derive other products from LiDAR, such as gap fraction (e.g.,
Table 6 Data and tools for establishing atmospheric ozone levels
TOMS
http://ozoneaq.gsfc.nasa.gov/data/toms/
GOME
http://www.ospo.noaa.gov/Products/atmosphere/gome/gome-A.html
OMI
http://neo.sci.gsfc.nasa.gov/view.php?datasetId=AURA_OZONE_E
NASA
Ozone
map tool
http://ozoneaq.gsfc.nasa.gov/tools/ozonemap/
Pre-processing of Remotely Sensed Imagery