

43
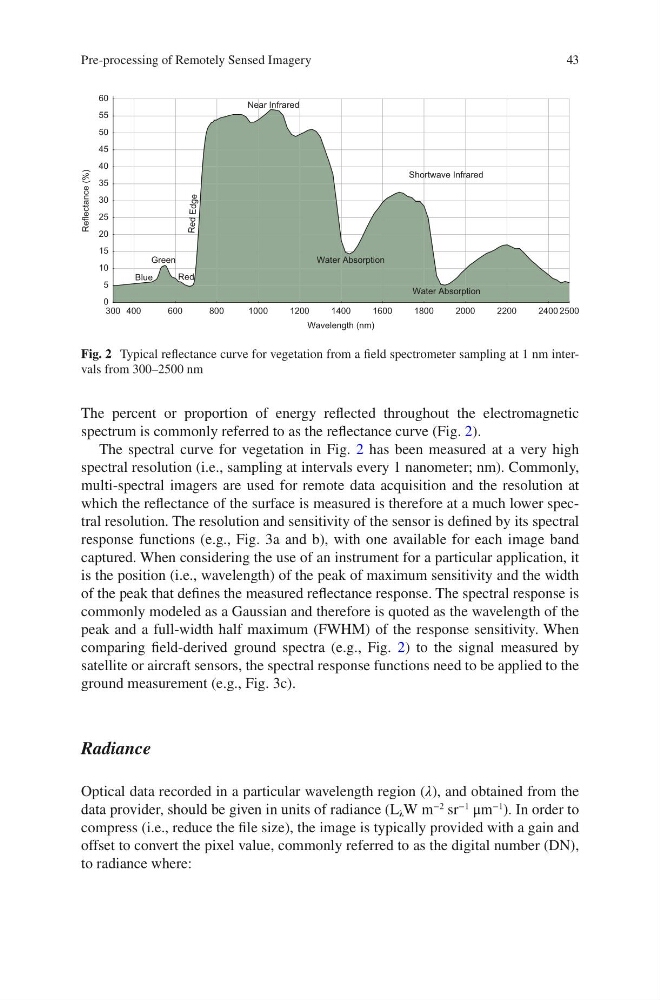
The percent or proportion of energy reflected throughout the electromagnetic
spectrum is commonly referred to as the reflectance curve (Fig. 2).
The spectral curve for vegetation in Fig. 2 has been measured at a very high
spectral resolution (i.e., sampling at intervals every 1 nanometer; nm). Commonly,
multi-spectral imagers are used for remote data acquisition and the resolution at
which the reflectance of the surface is measured is therefore at a much lower spectral resolution. The resolution and sensitivity of the sensor is defined by its spectral
response functions (e.g., Fig. 3a and b), with one available for each image band
captured. When considering the use of an instrument for a particular application, it
is the position (i.e., wavelength) of the peak of maximum sensitivity and the width
of the peak that defines the measured reflectance response. The spectral response is
commonly modeled as a Gaussian and therefore is quoted as the wavelength of the
peak and a full-width half maximum (FWHM) of the response sensitivity. When
comparing field-derived ground spectra (e.g., Fig. 2) to the signal measured by
satellite or aircraft sensors, the spectral response functions need to be applied to the
ground measurement (e.g., Fig. 3c).
Radiance
Optical data recorded in a particular wavelength region (λ), and obtained from the
data provider, should be given in units of radiance (L λ W m
−2
sr
−1
μm
−1
). In order to
compress (i.e., reduce the file size), the image is typically provided with a gain and
offset to convert the pixel value, commonly referred to as the digital number (DN),
to radiance where:
2500
300 400
600
800
1000
1200
1400
1600
1800
2000
2200
2400
60
0
5
10
15
20
25
30
35
40
45
50
55
Wavelength (nm)
Reflectance (%)
Green
Blue
Red
Red Edge
Near Infrared
Shortwave Infrared
Water Absorption
Water Absorption
Fig. 2 Typical reflectance curve for vegetation from a field spectrometer sampling at 1 nm intervals from 300–2500 nm
Pre-processing of Remotely Sensed Imagery
The percent or proportion of energy reflected throughout the electromagnetic
spectrum is commonly referred to as the reflectance curve (Fig. 2).
The spectral curve for vegetation in Fig. 2 has been measured at a very high
spectral resolution (i.e., sampling at intervals every 1 nanometer; nm). Commonly,
multi-spectral imagers are used for remote data acquisition and the resolution at
which the reflectance of the surface is measured is therefore at a much lower spectral resolution. The resolution and sensitivity of the sensor is defined by its spectral
response functions (e.g., Fig. 3a and b), with one available for each image band
captured. When considering the use of an instrument for a particular application, it
is the position (i.e., wavelength) of the peak of maximum sensitivity and the width
of the peak that defines the measured reflectance response. The spectral response is
commonly modeled as a Gaussian and therefore is quoted as the wavelength of the
peak and a full-width half maximum (FWHM) of the response sensitivity. When
comparing field-derived ground spectra (e.g., Fig. 2) to the signal measured by
satellite or aircraft sensors, the spectral response functions need to be applied to the
ground measurement (e.g., Fig. 3c).
Radiance
Optical data recorded in a particular wavelength region (λ), and obtained from the
data provider, should be given in units of radiance (L λ W m
−2
sr
−1
μm
−1
). In order to
compress (i.e., reduce the file size), the image is typically provided with a gain and
offset to convert the pixel value, commonly referred to as the digital number (DN),
to radiance where:
2500
300 400
600
800
1000
1200
1400
1600
1800
2000
2200
2400
60
0
5
10
15
20
25
30
35
40
45
50
55
Wavelength (nm)
Reflectance (%)
Green
Blue
Red
Red Edge
Near Infrared
Shortwave Infrared
Water Absorption
Water Absorption
Fig. 2 Typical reflectance curve for vegetation from a field spectrometer sampling at 1 nm intervals from 300–2500 nm
Pre-processing of Remotely Sensed Imagery