

268
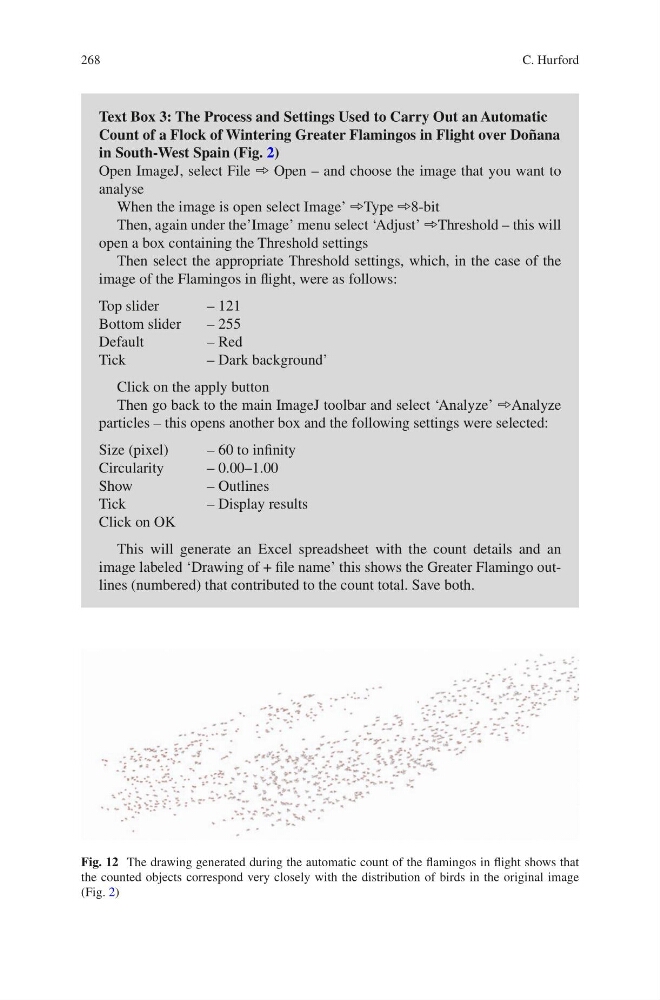
Fig. 12 The drawing generated during the automatic count of the flamingos in flight shows that
the counted objects correspond very closely with the distribution of birds in the original image
(Fig. 2)
Text Box 3: The Process and Settings Used to Carry Out an Automatic
Count of a Flock of Wintering Greater Flamingos in Flight over Doñana
in South-West Spain (Fig. 2)
Open ImageJ, select File ➾ Open – and choose the image that you want to
analyse
When the image is open select Image’ ➾Type ➾8-bit
Then, again under the’Image’ menu select ‘Adjust’ ➾Threshold – this will
open a box containing the Threshold settings
Then select the appropriate Threshold settings, which, in the case of the
image of the Flamingos in flight, were as follows:
Top slider
– 121
Bottom slider
– 255
Default
– Red
Tick
– Dark background’
Click on the apply button
Then go back to the main ImageJ toolbar and select ‘Analyze’ ➾Analyze
particles – this opens another box and the following settings were selected:
Size (pixel)
– 60 to infinity
Circularity
– 0.00–1.00
Show
– Outlines
Tick
– Display results
Click on OK
This will generate an Excel spreadsheet with the count details and an
image labeled ‘Drawing of + file name’ this shows the Greater Flamingo outlines (numbered) that contributed to the count total. Save both.
C. Hurford
Fig. 12 The drawing generated during the automatic count of the flamingos in flight shows that
the counted objects correspond very closely with the distribution of birds in the original image
(Fig. 2)
Text Box 3: The Process and Settings Used to Carry Out an Automatic
Count of a Flock of Wintering Greater Flamingos in Flight over Doñana
in South-West Spain (Fig. 2)
Open ImageJ, select File ➾ Open – and choose the image that you want to
analyse
When the image is open select Image’ ➾Type ➾8-bit
Then, again under the’Image’ menu select ‘Adjust’ ➾Threshold – this will
open a box containing the Threshold settings
Then select the appropriate Threshold settings, which, in the case of the
image of the Flamingos in flight, were as follows:
Top slider
– 121
Bottom slider
– 255
Default
– Red
Tick
– Dark background’
Click on the apply button
Then go back to the main ImageJ toolbar and select ‘Analyze’ ➾Analyze
particles – this opens another box and the following settings were selected:
Size (pixel)
– 60 to infinity
Circularity
– 0.00–1.00
Show
– Outlines
Tick
– Display results
Click on OK
This will generate an Excel spreadsheet with the count details and an
image labeled ‘Drawing of + file name’ this shows the Greater Flamingo outlines (numbered) that contributed to the count total. Save both.
C. Hurford