

255
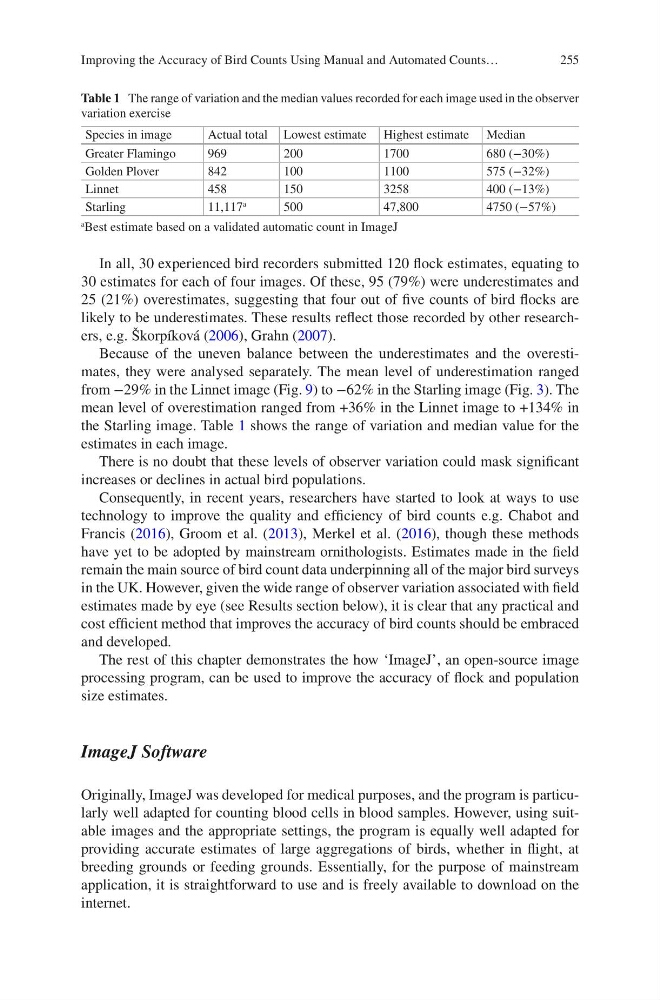
Table 1 The range of variation and the median values recorded for each image used in the observer
variation exercise
Species in image
Actual total Lowest estimate Highest estimate Median
Greater Flamingo
969
200
1700
680 (−30%)
Golden Plover
842
100
1100
575 (−32%)
Linnet
458
150
3258
400 (−13%)
Starling
11,117
a
500
47,800
4750 (−57%)
a Best estimate based on a validated automatic count in ImageJ
In all, 30 experienced bird recorders submitted 120 flock estimates, equating to
30 estimates for each of four images. Of these, 95 (79%) were underestimates and
25 (21%) overestimates, suggesting that four out of five counts of bird flocks are
likely to be underestimates. These results reflect those recorded by other researchers, e.g. Škorpíková (2006), Grahn (2007).
Because of the uneven balance between the underestimates and the overestimates, they were analysed separately. The mean level of underestimation ranged
from −29% in the Linnet image (Fig. 9) to −62% in the Starling image (Fig. 3). The
mean level of overestimation ranged from +36% in the Linnet image to +134% in
the Starling image. Table 1 shows the range of variation and median value for the
estimates in each image.
There is no doubt that these levels of observer variation could mask significant
increases or declines in actual bird populations.
Consequently, in recent years, researchers have started to look at ways to use
technology to improve the quality and efficiency of bird counts e.g. Chabot and
Francis (2016), Groom et al. (2013), Merkel et al. (2016), though these methods
have yet to be adopted by mainstream ornithologists. Estimates made in the field
remain the main source of bird count data underpinning all of the major bird surveys
in the UK. However, given the wide range of observer variation associated with field
estimates made by eye (see Results section below), it is clear that any practical and
cost efficient method that improves the accuracy of bird counts should be embraced
and developed.
The rest of this chapter demonstrates the how ‘ImageJ’, an open-source image
processing program, can be used to improve the accuracy of flock and population
size estimates.
ImageJ Software
Originally, ImageJ was developed for medical purposes, and the program is particularly well adapted for counting blood cells in blood samples. However, using suitable images and the appropriate settings, the program is equally well adapted for
providing accurate estimates of large aggregations of birds, whether in flight, at
breeding grounds or feeding grounds. Essentially, for the purpose of mainstream
application, it is straightforward to use and is freely available to download on the
internet.
Improving the Accuracy of Bird Counts Using Manual and Automated Counts…
Table 1 The range of variation and the median values recorded for each image used in the observer
variation exercise
Species in image
Actual total Lowest estimate Highest estimate Median
Greater Flamingo
969
200
1700
680 (−30%)
Golden Plover
842
100
1100
575 (−32%)
Linnet
458
150
3258
400 (−13%)
Starling
11,117
a
500
47,800
4750 (−57%)
a Best estimate based on a validated automatic count in ImageJ
In all, 30 experienced bird recorders submitted 120 flock estimates, equating to
30 estimates for each of four images. Of these, 95 (79%) were underestimates and
25 (21%) overestimates, suggesting that four out of five counts of bird flocks are
likely to be underestimates. These results reflect those recorded by other researchers, e.g. Škorpíková (2006), Grahn (2007).
Because of the uneven balance between the underestimates and the overestimates, they were analysed separately. The mean level of underestimation ranged
from −29% in the Linnet image (Fig. 9) to −62% in the Starling image (Fig. 3). The
mean level of overestimation ranged from +36% in the Linnet image to +134% in
the Starling image. Table 1 shows the range of variation and median value for the
estimates in each image.
There is no doubt that these levels of observer variation could mask significant
increases or declines in actual bird populations.
Consequently, in recent years, researchers have started to look at ways to use
technology to improve the quality and efficiency of bird counts e.g. Chabot and
Francis (2016), Groom et al. (2013), Merkel et al. (2016), though these methods
have yet to be adopted by mainstream ornithologists. Estimates made in the field
remain the main source of bird count data underpinning all of the major bird surveys
in the UK. However, given the wide range of observer variation associated with field
estimates made by eye (see Results section below), it is clear that any practical and
cost efficient method that improves the accuracy of bird counts should be embraced
and developed.
The rest of this chapter demonstrates the how ‘ImageJ’, an open-source image
processing program, can be used to improve the accuracy of flock and population
size estimates.
ImageJ Software
Originally, ImageJ was developed for medical purposes, and the program is particularly well adapted for counting blood cells in blood samples. However, using suitable images and the appropriate settings, the program is equally well adapted for
providing accurate estimates of large aggregations of birds, whether in flight, at
breeding grounds or feeding grounds. Essentially, for the purpose of mainstream
application, it is straightforward to use and is freely available to download on the
internet.
Improving the Accuracy of Bird Counts Using Manual and Automated Counts…