

193
dent by the large confidence intervals (Fig. 3). These are much smaller in the case
for ALL and frequent species. This effect was attributed to the small number of
samples within the infrequent species (72 samples spread across five classes, see
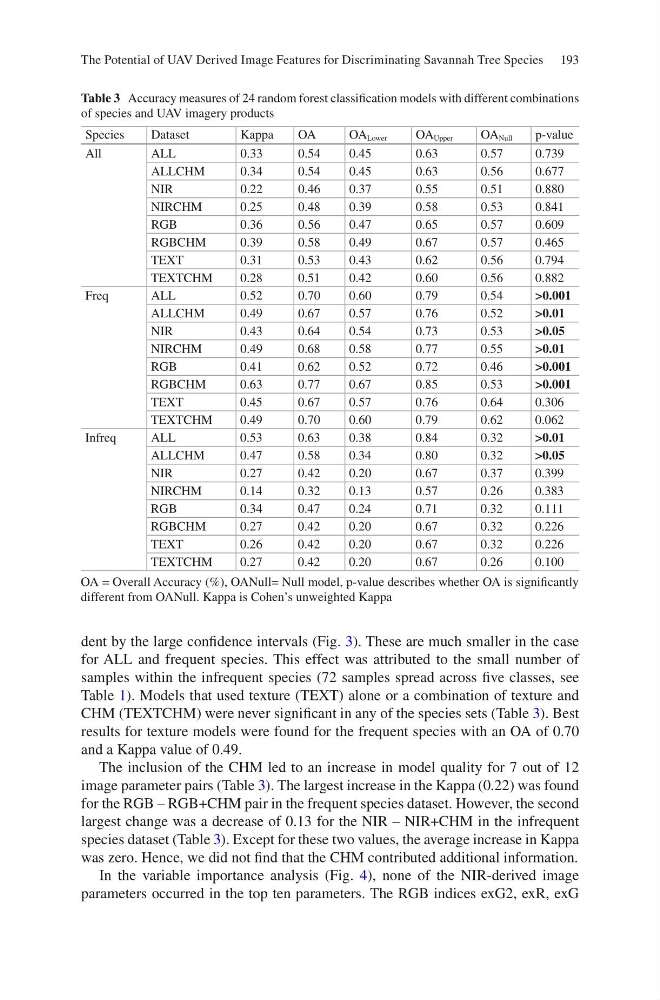
Table 1). Models that used texture (TEXT) alone or a combination of texture and
CHM (TEXTCHM) were never significant in any of the species sets (Table 3). Best
results for texture models were found for the frequent species with an OA of 0.70
and a Kappa value of 0.49.
The inclusion of the CHM led to an increase in model quality for 7 out of 12
image parameter pairs (Table 3). The largest increase in the Kappa (0.22) was found
for the RGB – RGB+CHM pair in the frequent species dataset. However, the second
largest change was a decrease of 0.13 for the NIR – NIR+CHM in the infrequent
species dataset (Table 3). Except for these two values, the average increase in Kappa
was zero. Hence, we did not find that the CHM contributed additional information.
In the variable importance analysis (Fig. 4), none of the NIR-derived image
parameters occurred in the top ten parameters. The RGB indices exG2, exR, exG
Table 3 Accuracy measures of 24 random forest classification models with different combinations
of species and UAV imagery products
Species
Dataset
Kappa
OA
OA Lower
OA Upper
OA Null
p-value
All
ALL
0.33
0.54
0.45
0.63
0.57
0.739
ALLCHM
0.34
0.54
0.45
0.63
0.56
0.677
NIR
0.22
0.46
0.37
0.55
0.51
0.880
NIRCHM
0.25
0.48
0.39
0.58
0.53
0.841
RGB
0.36
0.56
0.47
0.65
0.57
0.609
RGBCHM
0.39
0.58
0.49
0.67
0.57
0.465
TEXT
0.31
0.53
0.43
0.62
0.56
0.794
TEXTCHM
0.28
0.51
0.42
0.60
0.56
0.882
Freq
ALL
0.52
0.70
0.60
0.79
0.54
>0.001
ALLCHM
0.49
0.67
0.57
0.76
0.52
>0.01
NIR
0.43
0.64
0.54
0.73
0.53
>0.05
NIRCHM
0.49
0.68
0.58
0.77
0.55
>0.01
RGB
0.41
0.62
0.52
0.72
0.46
>0.001
RGBCHM
0.63
0.77
0.67
0.85
0.53
>0.001
TEXT
0.45
0.67
0.57
0.76
0.64
0.306
TEXTCHM
0.49
0.70
0.60
0.79
0.62
0.062
Infreq
ALL
0.53
0.63
0.38
0.84
0.32
>0.01
ALLCHM
0.47
0.58
0.34
0.80
0.32
>0.05
NIR
0.27
0.42
0.20
0.67
0.37
0.399
NIRCHM
0.14
0.32
0.13
0.57
0.26
0.383
RGB
0.34
0.47
0.24
0.71
0.32
0.111
RGBCHM
0.27
0.42
0.20
0.67
0.32
0.226
TEXT
0.26
0.42
0.20
0.67
0.32
0.226
TEXTCHM
0.27
0.42
0.20
0.67
0.26
0.100
OA = Overall Accuracy (%), OANull= Null model, p-value describes whether OA is significantly
different from OANull. Kappa is Cohen’s unweighted Kappa
The Potential of UAV Derived Image Features for Discriminating Savannah Tree Species
dent by the large confidence intervals (Fig. 3). These are much smaller in the case
for ALL and frequent species. This effect was attributed to the small number of
samples within the infrequent species (72 samples spread across five classes, see
Table 1). Models that used texture (TEXT) alone or a combination of texture and
CHM (TEXTCHM) were never significant in any of the species sets (Table 3). Best
results for texture models were found for the frequent species with an OA of 0.70
and a Kappa value of 0.49.
The inclusion of the CHM led to an increase in model quality for 7 out of 12
image parameter pairs (Table 3). The largest increase in the Kappa (0.22) was found
for the RGB – RGB+CHM pair in the frequent species dataset. However, the second
largest change was a decrease of 0.13 for the NIR – NIR+CHM in the infrequent
species dataset (Table 3). Except for these two values, the average increase in Kappa
was zero. Hence, we did not find that the CHM contributed additional information.
In the variable importance analysis (Fig. 4), none of the NIR-derived image
parameters occurred in the top ten parameters. The RGB indices exG2, exR, exG
Table 3 Accuracy measures of 24 random forest classification models with different combinations
of species and UAV imagery products
Species
Dataset
Kappa
OA
OA Lower
OA Upper
OA Null
p-value
All
ALL
0.33
0.54
0.45
0.63
0.57
0.739
ALLCHM
0.34
0.54
0.45
0.63
0.56
0.677
NIR
0.22
0.46
0.37
0.55
0.51
0.880
NIRCHM
0.25
0.48
0.39
0.58
0.53
0.841
RGB
0.36
0.56
0.47
0.65
0.57
0.609
RGBCHM
0.39
0.58
0.49
0.67
0.57
0.465
TEXT
0.31
0.53
0.43
0.62
0.56
0.794
TEXTCHM
0.28
0.51
0.42
0.60
0.56
0.882
Freq
ALL
0.52
0.70
0.60
0.79
0.54
>0.001
ALLCHM
0.49
0.67
0.57
0.76
0.52
>0.01
NIR
0.43
0.64
0.54
0.73
0.53
>0.05
NIRCHM
0.49
0.68
0.58
0.77
0.55
>0.01
RGB
0.41
0.62
0.52
0.72
0.46
>0.001
RGBCHM
0.63
0.77
0.67
0.85
0.53
>0.001
TEXT
0.45
0.67
0.57
0.76
0.64
0.306
TEXTCHM
0.49
0.70
0.60
0.79
0.62
0.062
Infreq
ALL
0.53
0.63
0.38
0.84
0.32
>0.01
ALLCHM
0.47
0.58
0.34
0.80
0.32
>0.05
NIR
0.27
0.42
0.20
0.67
0.37
0.399
NIRCHM
0.14
0.32
0.13
0.57
0.26
0.383
RGB
0.34
0.47
0.24
0.71
0.32
0.111
RGBCHM
0.27
0.42
0.20
0.67
0.32
0.226
TEXT
0.26
0.42
0.20
0.67
0.32
0.226
TEXTCHM
0.27
0.42
0.20
0.67
0.26
0.100
OA = Overall Accuracy (%), OANull= Null model, p-value describes whether OA is significantly
different from OANull. Kappa is Cohen’s unweighted Kappa
The Potential of UAV Derived Image Features for Discriminating Savannah Tree Species