

159
The INTA-AHS hyperspectral system performed well in mapping the dominant
shrub species of DNP. The spatial resolution of 2–7 m (see Table 1) was sufficient
to deal with the range of canopy sizes (typically 1–2 m) encountered in the shrublands of DNP. The study area was covered with two flight lines in the 2005 campaign and three flight lines in the 2008 campaign, which allowed the generation of
a geometrically and radiometrically correct image mosaic for each year.
The plant species distribution maps obtained with the INTA-AHS hypespectral
corroborates the knowledge and work of previous expert researchers, in terms of the
spatial distribution and plant cover fraction. Furthermore, the spatially-explicit plant
species distribution detected gave more insights into the spatial distribution of shrub
species that were not possible using traditional vegetation survey methods. For example, E. scoparia covered a larger area and the fraction cover was greater in Naves than
published in previous studies and this was similar to the distribution of R. officinalis
in the Manto Arrasado habitat.
Having the potential to map and monitor the changes in species composition over
time would help us to detect, monitor, measure and predict increases or decreases in
biological diversity, as well as help to predict the impacts of these changes on ecosystem functions (Trochet and Schmeller 2013). In this work, two flight campaigns
were carried out in two different years, which represented an excellent opportunity
to show the potential of imaging spectroscopy for mapping and monitoring
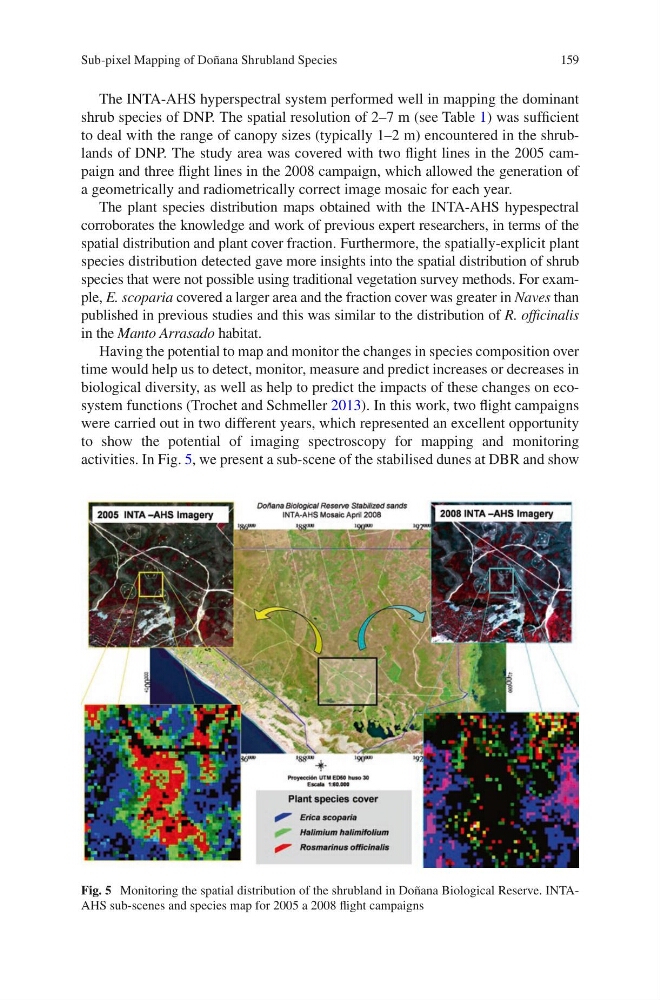
activities. In Fig. 5, we present a sub-scene of the stabilised dunes at DBR and show
Fig. 5 Monitoring the spatial distribution of the shrubland in Doñana Biological Reserve. INTAAHS sub-scenes and species map for 2005 a 2008 flight campaigns
Sub-pixel Mapping of Doñana Shrubland Species
The INTA-AHS hyperspectral system performed well in mapping the dominant
shrub species of DNP. The spatial resolution of 2–7 m (see Table 1) was sufficient
to deal with the range of canopy sizes (typically 1–2 m) encountered in the shrublands of DNP. The study area was covered with two flight lines in the 2005 campaign and three flight lines in the 2008 campaign, which allowed the generation of
a geometrically and radiometrically correct image mosaic for each year.
The plant species distribution maps obtained with the INTA-AHS hypespectral
corroborates the knowledge and work of previous expert researchers, in terms of the
spatial distribution and plant cover fraction. Furthermore, the spatially-explicit plant
species distribution detected gave more insights into the spatial distribution of shrub
species that were not possible using traditional vegetation survey methods. For example, E. scoparia covered a larger area and the fraction cover was greater in Naves than
published in previous studies and this was similar to the distribution of R. officinalis
in the Manto Arrasado habitat.
Having the potential to map and monitor the changes in species composition over
time would help us to detect, monitor, measure and predict increases or decreases in
biological diversity, as well as help to predict the impacts of these changes on ecosystem functions (Trochet and Schmeller 2013). In this work, two flight campaigns
were carried out in two different years, which represented an excellent opportunity
to show the potential of imaging spectroscopy for mapping and monitoring
activities. In Fig. 5, we present a sub-scene of the stabilised dunes at DBR and show
Fig. 5 Monitoring the spatial distribution of the shrubland in Doñana Biological Reserve. INTAAHS sub-scenes and species map for 2005 a 2008 flight campaigns
Sub-pixel Mapping of Doñana Shrubland Species