

155
ρ
λ
ρ λ
ρ
λ
ρ
λ
pixel
veg
veg
soil
SOIL
litter
litter
F
F
F
( ) =
( )+
( )+
( )+
∑ •
•
•
e e λ
( )
where ρ pixel is the reflectance of the pixel, F and ρ are the cover fraction and the
reflectance of each endmember, respectively, and e is the error.
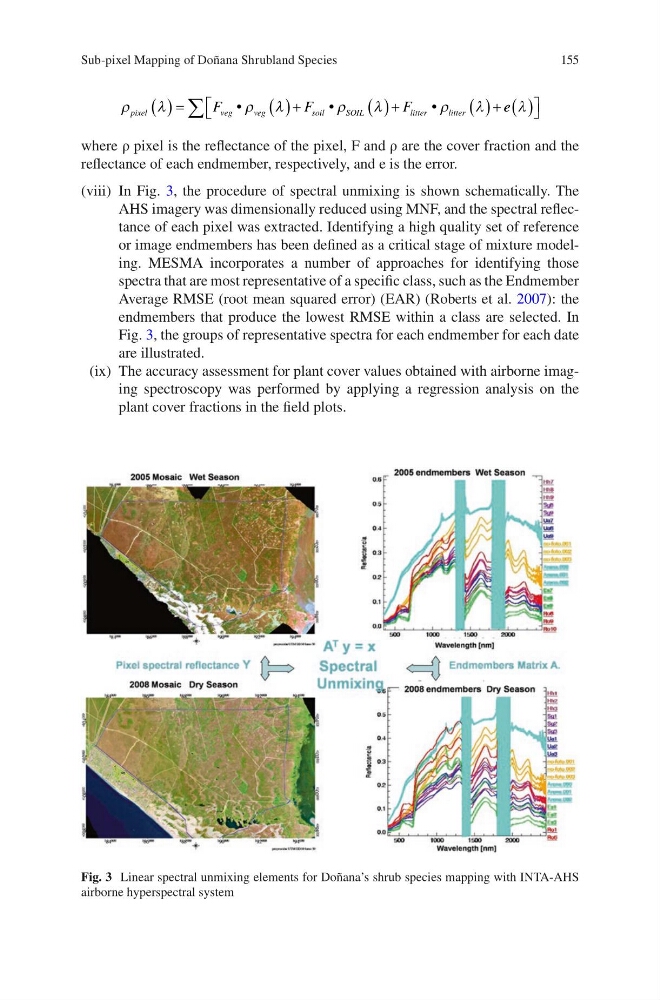
(viii) In Fig. 3, the procedure of spectral unmixing is shown schematically. The
AHS imagery was dimensionally reduced using MNF, and the spectral reflectance of each pixel was extracted. Identifying a high quality set of reference
or image endmembers has been defined as a critical stage of mixture modeling. MESMA incorporates a number of approaches for identifying those
spectra that are most representative of a specific class, such as the Endmember
Average RMSE (root mean squared error) (EAR) (Roberts et al. 2007): the
endmembers that produce the lowest RMSE within a class are selected. In
Fig. 3, the groups of representative spectra for each endmember for each date
are illustrated.
(ix) The accuracy assessment for plant cover values obtained with airborne imaging spectroscopy was performed by applying a regression analysis on the
plant cover fractions in the field plots.
Fig. 3 Linear spectral unmixing elements for Doñana’s shrub species mapping with INTA-AHS
airborne hyperspectral system
Sub-pixel Mapping of Doñana Shrubland Species
ρ
λ
ρ λ
ρ
λ
ρ
λ
pixel
veg
veg
soil
SOIL
litter
litter
F
F
F
( ) =
( )+
( )+
( )+
∑ •
•
•
e e λ
( )
where ρ pixel is the reflectance of the pixel, F and ρ are the cover fraction and the
reflectance of each endmember, respectively, and e is the error.
(viii) In Fig. 3, the procedure of spectral unmixing is shown schematically. The
AHS imagery was dimensionally reduced using MNF, and the spectral reflectance of each pixel was extracted. Identifying a high quality set of reference
or image endmembers has been defined as a critical stage of mixture modeling. MESMA incorporates a number of approaches for identifying those
spectra that are most representative of a specific class, such as the Endmember
Average RMSE (root mean squared error) (EAR) (Roberts et al. 2007): the
endmembers that produce the lowest RMSE within a class are selected. In
Fig. 3, the groups of representative spectra for each endmember for each date
are illustrated.
(ix) The accuracy assessment for plant cover values obtained with airborne imaging spectroscopy was performed by applying a regression analysis on the
plant cover fractions in the field plots.
Fig. 3 Linear spectral unmixing elements for Doñana’s shrub species mapping with INTA-AHS
airborne hyperspectral system
Sub-pixel Mapping of Doñana Shrubland Species