

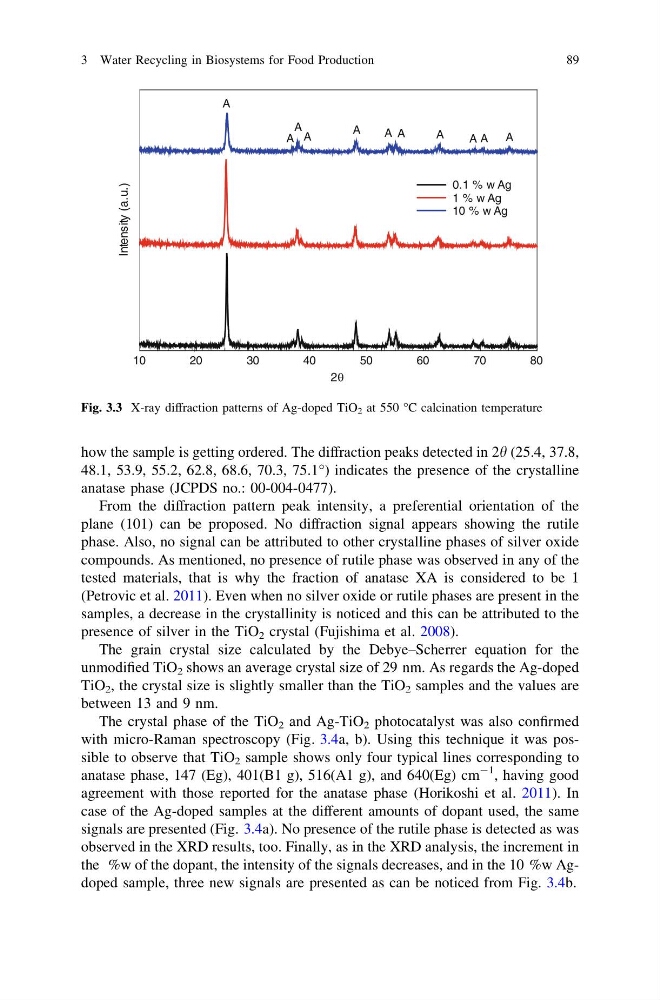
how the sample is getting ordered. The diffraction peaks detected in 2h (25.4, 37.8,
48.1, 53.9, 55.2, 62.8, 68.6, 70.3, 75.1°) indicates the presence of the crystalline
anatase phase (JCPDS no.: 00-004-0477).
From the diffraction pattern peak intensity, a preferential orientation of the
plane (101) can be proposed. No diffraction signal appears showing the rutile
phase. Also, no signal can be attributed to other crystalline phases of silver oxide
compounds. As mentioned, no presence of rutile phase was observed in any of the
tested materials, that is why the fraction of anatase XA is considered to be 1
(Petrovic et al. 2011). Even when no silver oxide or rutile phases are present in the
samples, a decrease in the crystallinity is noticed and this can be attributed to the
presence of silver in the TiO 2 crystal (Fujishima et al. 2008).
The grain crystal size calculated by the Debye–Scherrer equation for the
unmodified TiO 2 shows an average crystal size of 29 nm. As regards the Ag-doped
TiO 2 , the crystal size is slightly smaller than the TiO 2 samples and the values are
between 13 and 9 nm.
The crystal phase of the TiO 2 and Ag-TiO 2 photocatalyst was also confirmed
with micro-Raman spectroscopy (Fig. 3.4a, b). Using this technique it was possible to observe that TiO 2 sample shows only four typical lines corresponding to
anatase phase, 147 (Eg), 401(B1 g), 516(A1 g), and 640(Eg) cm
-1 , having good
agreement with those reported for the anatase phase (Horikoshi et al. 2011). In
case of the Ag-doped samples at the different amounts of dopant used, the same
signals are presented (Fig. 3.4a). No presence of the rutile phase is detected as was
observed in the XRD results, too. Finally, as in the XRD analysis, the increment in
the %w of the dopant, the intensity of the signals decreases, and in the 10 %w Agdoped sample, three new signals are presented as can be noticed from Fig. 3.4b.
10
20
30
40
50
60
70
80
Intensity (a.u.)
2θ
0.1 % w Ag
1 % w Ag
10 % w Ag
A
A
A
A
A
A A
A
A
A
A
Fig. 3.3 X-ray diffraction patterns of Ag-doped TiO 2 at 550 °C calcination temperature
3 Water Recycling in Biosystems for Food Production
89
48.1, 53.9, 55.2, 62.8, 68.6, 70.3, 75.1°) indicates the presence of the crystalline
anatase phase (JCPDS no.: 00-004-0477).
From the diffraction pattern peak intensity, a preferential orientation of the
plane (101) can be proposed. No diffraction signal appears showing the rutile
phase. Also, no signal can be attributed to other crystalline phases of silver oxide
compounds. As mentioned, no presence of rutile phase was observed in any of the
tested materials, that is why the fraction of anatase XA is considered to be 1
(Petrovic et al. 2011). Even when no silver oxide or rutile phases are present in the
samples, a decrease in the crystallinity is noticed and this can be attributed to the
presence of silver in the TiO 2 crystal (Fujishima et al. 2008).
The grain crystal size calculated by the Debye–Scherrer equation for the
unmodified TiO 2 shows an average crystal size of 29 nm. As regards the Ag-doped
TiO 2 , the crystal size is slightly smaller than the TiO 2 samples and the values are
between 13 and 9 nm.
The crystal phase of the TiO 2 and Ag-TiO 2 photocatalyst was also confirmed
with micro-Raman spectroscopy (Fig. 3.4a, b). Using this technique it was possible to observe that TiO 2 sample shows only four typical lines corresponding to
anatase phase, 147 (Eg), 401(B1 g), 516(A1 g), and 640(Eg) cm
-1 , having good
agreement with those reported for the anatase phase (Horikoshi et al. 2011). In
case of the Ag-doped samples at the different amounts of dopant used, the same
signals are presented (Fig. 3.4a). No presence of the rutile phase is detected as was
observed in the XRD results, too. Finally, as in the XRD analysis, the increment in
the %w of the dopant, the intensity of the signals decreases, and in the 10 %w Agdoped sample, three new signals are presented as can be noticed from Fig. 3.4b.
10
20
30
40
50
60
70
80
Intensity (a.u.)
2θ
0.1 % w Ag
1 % w Ag
10 % w Ag
A
A
A
A
A
A A
A
A
A
A
Fig. 3.3 X-ray diffraction patterns of Ag-doped TiO 2 at 550 °C calcination temperature
3 Water Recycling in Biosystems for Food Production
89