

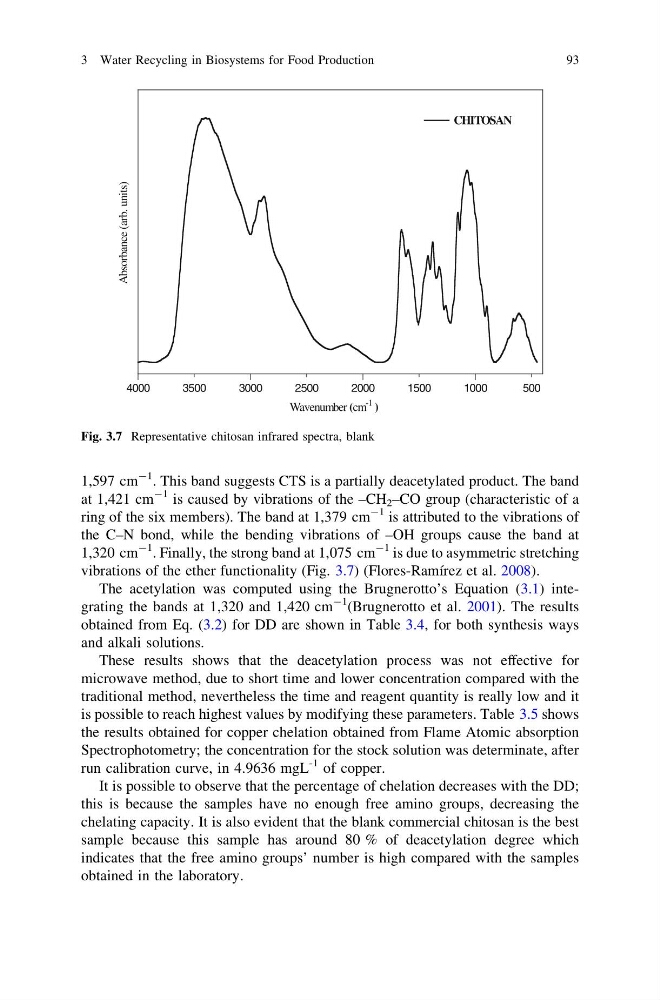
1,597 cm
-1 . This band suggests CTS is a partially deacetylated product. The band
at 1,421 cm
-1 is caused by vibrations of the –CH 2 –CO group (characteristic of a
ring of the six members). The band at 1,379 cm
-1 is attributed to the vibrations of
the C–N bond, while the bending vibrations of –OH groups cause the band at
1,320 cm
-1 . Finally, the strong band at 1,075 cm
-1 is due to asymmetric stretching
vibrations of the ether functionality (Fig. 3.7) (Flores-Ramírez et al. 2008).
The acetylation was computed using the Brugnerotto’s Equation (3.1) integrating the bands at 1,320 and 1,420 cm
-1 (Brugnerotto et al. 2001). The results
obtained from Eq. (3.2) for DD are shown in Table 3.4, for both synthesis ways
and alkali solutions.
These results shows that the deacetylation process was not effective for
microwave method, due to short time and lower concentration compared with the
traditional method, nevertheless the time and reagent quantity is really low and it
is possible to reach highest values by modifying these parameters. Table 3.5 shows
the results obtained for copper chelation obtained from Flame Atomic absorption
Spectrophotometry; the concentration for the stock solution was determinate, after
run calibration curve, in 4.9636 mgL
-1 of copper.
It is possible to observe that the percentage of chelation decreases with the DD;
this is because the samples have no enough free amino groups, decreasing the
chelating capacity. It is also evident that the blank commercial chitosan is the best
sample because this sample has around 80 % of deacetylation degree which
indicates that the free amino groups’ number is high compared with the samples
obtained in the laboratory.
4000
3500
3000
2500
2000
1500
1000
500
CHITOSAN
Absorbance (arb. units)
Wavenumber (cm
-1 )
Fig. 3.7 Representative chitosan infrared spectra, blank
3 Water Recycling in Biosystems for Food Production
93
-1 . This band suggests CTS is a partially deacetylated product. The band
at 1,421 cm
-1 is caused by vibrations of the –CH 2 –CO group (characteristic of a
ring of the six members). The band at 1,379 cm
-1 is attributed to the vibrations of
the C–N bond, while the bending vibrations of –OH groups cause the band at
1,320 cm
-1 . Finally, the strong band at 1,075 cm
-1 is due to asymmetric stretching
vibrations of the ether functionality (Fig. 3.7) (Flores-Ramírez et al. 2008).
The acetylation was computed using the Brugnerotto’s Equation (3.1) integrating the bands at 1,320 and 1,420 cm
-1 (Brugnerotto et al. 2001). The results
obtained from Eq. (3.2) for DD are shown in Table 3.4, for both synthesis ways
and alkali solutions.
These results shows that the deacetylation process was not effective for
microwave method, due to short time and lower concentration compared with the
traditional method, nevertheless the time and reagent quantity is really low and it
is possible to reach highest values by modifying these parameters. Table 3.5 shows
the results obtained for copper chelation obtained from Flame Atomic absorption
Spectrophotometry; the concentration for the stock solution was determinate, after
run calibration curve, in 4.9636 mgL
-1 of copper.
It is possible to observe that the percentage of chelation decreases with the DD;
this is because the samples have no enough free amino groups, decreasing the
chelating capacity. It is also evident that the blank commercial chitosan is the best
sample because this sample has around 80 % of deacetylation degree which
indicates that the free amino groups’ number is high compared with the samples
obtained in the laboratory.
4000
3500
3000
2500
2000
1500
1000
500
CHITOSAN
Absorbance (arb. units)
Wavenumber (cm
-1 )
Fig. 3.7 Representative chitosan infrared spectra, blank
3 Water Recycling in Biosystems for Food Production
93