

18 Eddies in the Red Sea as seen by Satellite SAR Imagery
375
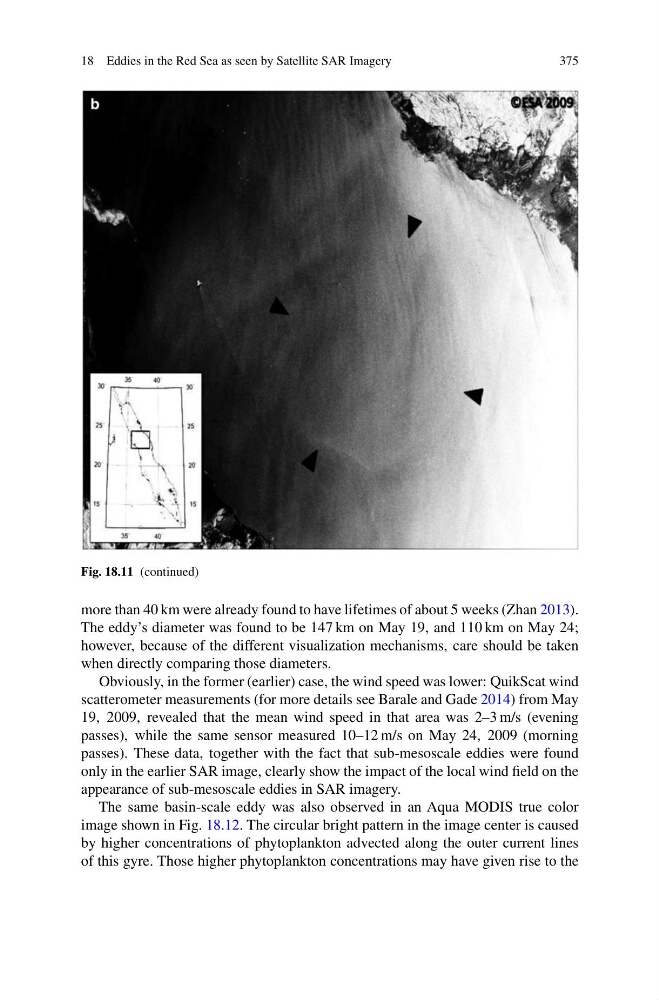
Fig. 18.11 (continued)
more than 40 km were already found to have lifetimes of about 5 weeks (Zhan 2013).
The eddy’s diameter was found to be 147 km on May 19, and 110 km on May 24;
however, because of the different visualization mechanisms, care should be taken
when directly comparing those diameters.
Obviously, in the former (earlier) case, the wind speed was lower: QuikScat wind
scatterometer measurements (for more details see Barale and Gade 2014) from May
19, 2009, revealed that the mean wind speed in that area was 2–3 m/s (evening
passes), while the same sensor measured 10–12 m/s on May 24, 2009 (morning
passes). These data, together with the fact that sub-mesoscale eddies were found
only in the earlier SAR image, clearly show the impact of the local wind field on the
appearance of sub-mesoscale eddies in SAR imagery.
The same basin-scale eddy was also observed in an Aqua MODIS true color
image shown in Fig. 18.12. The circular bright pattern in the image center is caused
by higher concentrations of phytoplankton advected along the outer current lines
of this gyre. Those higher phytoplankton concentrations may have given rise to the
375
Fig. 18.11 (continued)
more than 40 km were already found to have lifetimes of about 5 weeks (Zhan 2013).
The eddy’s diameter was found to be 147 km on May 19, and 110 km on May 24;
however, because of the different visualization mechanisms, care should be taken
when directly comparing those diameters.
Obviously, in the former (earlier) case, the wind speed was lower: QuikScat wind
scatterometer measurements (for more details see Barale and Gade 2014) from May
19, 2009, revealed that the mean wind speed in that area was 2–3 m/s (evening
passes), while the same sensor measured 10–12 m/s on May 24, 2009 (morning
passes). These data, together with the fact that sub-mesoscale eddies were found
only in the earlier SAR image, clearly show the impact of the local wind field on the
appearance of sub-mesoscale eddies in SAR imagery.
The same basin-scale eddy was also observed in an Aqua MODIS true color
image shown in Fig. 18.12. The circular bright pattern in the image center is caused
by higher concentrations of phytoplankton advected along the outer current lines
of this gyre. Those higher phytoplankton concentrations may have given rise to the