

18 Eddies in the Red Sea as seen by Satellite SAR Imagery
371
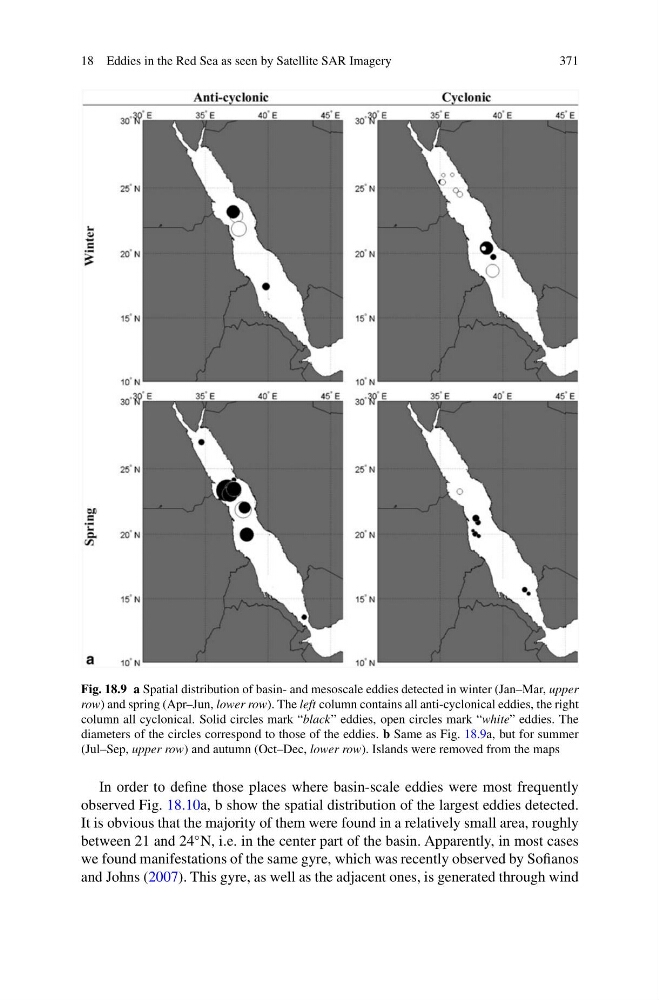
Fig. 18.9 a Spatial distribution of basin- and mesoscale eddies detected in winter (Jan–Mar, upper
row) and spring (Apr–Jun, lower row). The left column contains all anti-cyclonical eddies, the right
column all cyclonical. Solid circles mark “black” eddies, open circles mark “white” eddies. The
diameters of the circles correspond to those of the eddies. b Same as Fig. 18.9a, but for summer
(Jul–Sep, upper row) and autumn (Oct–Dec, lower row). Islands were removed from the maps
In order to define those places where basin-scale eddies were most frequently
observed Fig. 18.10a, b show the spatial distribution of the largest eddies detected.
It is obvious that the majority of them were found in a relatively small area, roughly
between 21 and 24
◦ N, i.e. in the center part of the basin. Apparently, in most cases
we found manifestations of the same gyre, which was recently observed by Sofianos
and Johns (2007). This gyre, as well as the adjacent ones, is generated through wind
371
Fig. 18.9 a Spatial distribution of basin- and mesoscale eddies detected in winter (Jan–Mar, upper
row) and spring (Apr–Jun, lower row). The left column contains all anti-cyclonical eddies, the right
column all cyclonical. Solid circles mark “black” eddies, open circles mark “white” eddies. The
diameters of the circles correspond to those of the eddies. b Same as Fig. 18.9a, but for summer
(Jul–Sep, upper row) and autumn (Oct–Dec, lower row). Islands were removed from the maps
In order to define those places where basin-scale eddies were most frequently
observed Fig. 18.10a, b show the spatial distribution of the largest eddies detected.
It is obvious that the majority of them were found in a relatively small area, roughly
between 21 and 24
◦ N, i.e. in the center part of the basin. Apparently, in most cases
we found manifestations of the same gyre, which was recently observed by Sofianos
and Johns (2007). This gyre, as well as the adjacent ones, is generated through wind