

18 Eddies in the Red Sea as seen by Satellite SAR Imagery
363
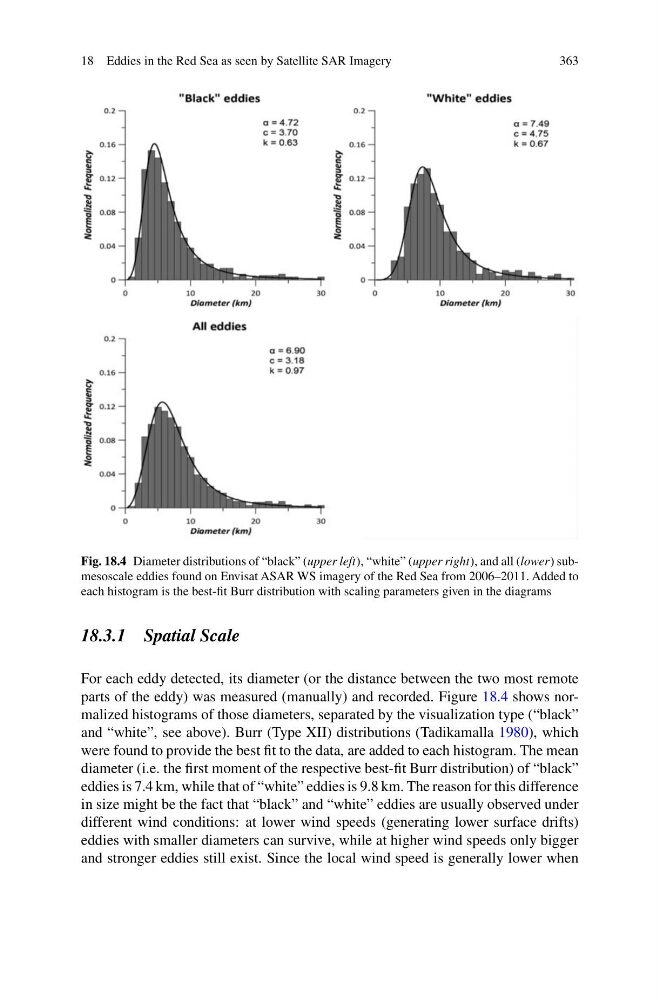
Fig. 18.4 Diameter distributions of “black” (upper left), “white” (upper right), and all (lower) submesoscale eddies found on Envisat ASAR WS imagery of the Red Sea from 2006–2011. Added to
each histogram is the best-fit Burr distribution with scaling parameters given in the diagrams
18.3.1 Spatial Scale
For each eddy detected, its diameter (or the distance between the two most remote
parts of the eddy) was measured (manually) and recorded. Figure 18.4 shows normalized histograms of those diameters, separated by the visualization type (“black”
and “white”, see above). Burr (Type XII) distributions (Tadikamalla 1980), which
were found to provide the best fit to the data, are added to each histogram. The mean
diameter (i.e. the first moment of the respective best-fit Burr distribution) of “black”
eddies is 7.4 km, while that of “white” eddies is 9.8 km. The reason for this difference
in size might be the fact that “black” and “white” eddies are usually observed under
different wind conditions: at lower wind speeds (generating lower surface drifts)
eddies with smaller diameters can survive, while at higher wind speeds only bigger
and stronger eddies still exist. Since the local wind speed is generally lower when
363
Fig. 18.4 Diameter distributions of “black” (upper left), “white” (upper right), and all (lower) submesoscale eddies found on Envisat ASAR WS imagery of the Red Sea from 2006–2011. Added to
each histogram is the best-fit Burr distribution with scaling parameters given in the diagrams
18.3.1 Spatial Scale
For each eddy detected, its diameter (or the distance between the two most remote
parts of the eddy) was measured (manually) and recorded. Figure 18.4 shows normalized histograms of those diameters, separated by the visualization type (“black”
and “white”, see above). Burr (Type XII) distributions (Tadikamalla 1980), which
were found to provide the best fit to the data, are added to each histogram. The mean
diameter (i.e. the first moment of the respective best-fit Burr distribution) of “black”
eddies is 7.4 km, while that of “white” eddies is 9.8 km. The reason for this difference
in size might be the fact that “black” and “white” eddies are usually observed under
different wind conditions: at lower wind speeds (generating lower surface drifts)
eddies with smaller diameters can survive, while at higher wind speeds only bigger
and stronger eddies still exist. Since the local wind speed is generally lower when