

15 Ship Surveillance with High Resolution TerraSAR-X Satellite in African Waters
297
One method for CFAR detection is to work directly with the histogram of the
background windows and set the threshold at the appropriate point in the tail of
the distribution. Choosing a parametric distribution model for the background is
equivalent to specifying the associated parametric probability density function f(x),
where x gives possible pixel values. Once f(x) has been chosen and its parameters
are estimated from the background samples, the probability of false alarm (PFA) for
the threshold T is given by
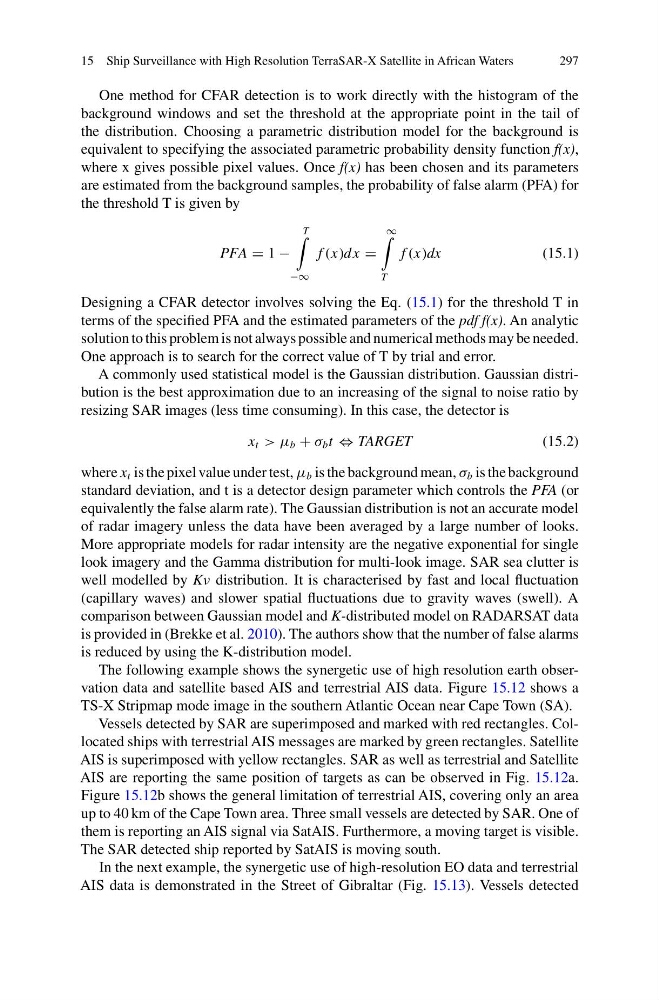
PFA = 1 −
T
−∞
f (x)dx =
∞
T
f (x)dx
(15.1)
Designing a CFAR detector involves solving the Eq. (15.1) for the threshold T in
terms of the specified PFA and the estimated parameters of the pdf f(x). An analytic
solution to this problem is not always possible and numerical methods may be needed.
One approach is to search for the correct value of T by trial and error.
A commonly used statistical model is the Gaussian distribution. Gaussian distribution is the best approximation due to an increasing of the signal to noise ratio by
resizing SAR images (less time consuming). In this case, the detector is
x t > μ b + σ b t ⇔ TARGET
(15.2)
where x t is the pixel value under test, μ b is the background mean, σ b is the background
standard deviation, and t is a detector design parameter which controls the PFA (or
equivalently the false alarm rate). The Gaussian distribution is not an accurate model
of radar imagery unless the data have been averaged by a large number of looks.
More appropriate models for radar intensity are the negative exponential for single
look imagery and the Gamma distribution for multi-look image. SAR sea clutter is
well modelled by Kν distribution. It is characterised by fast and local fluctuation
(capillary waves) and slower spatial fluctuations due to gravity waves (swell). A
comparison between Gaussian model and K-distributed model on RADARSAT data
is provided in (Brekke et al. 2010). The authors show that the number of false alarms
is reduced by using the K-distribution model.
The following example shows the synergetic use of high resolution earth observation data and satellite based AIS and terrestrial AIS data. Figure 15.12 shows a
TS-X Stripmap mode image in the southern Atlantic Ocean near Cape Town (SA).
Vessels detected by SAR are superimposed and marked with red rectangles. Collocated ships with terrestrial AIS messages are marked by green rectangles. Satellite
AIS is superimposed with yellow rectangles. SAR as well as terrestrial and Satellite
AIS are reporting the same position of targets as can be observed in Fig. 15.12a.
Figure 15.12b shows the general limitation of terrestrial AIS, covering only an area
up to 40 km of the Cape Town area. Three small vessels are detected by SAR. One of
them is reporting an AIS signal via SatAIS. Furthermore, a moving target is visible.
The SAR detected ship reported by SatAIS is moving south.
In the next example, the synergetic use of high-resolution EO data and terrestrial
AIS data is demonstrated in the Street of Gibraltar (Fig. 15.13). Vessels detected
297
One method for CFAR detection is to work directly with the histogram of the
background windows and set the threshold at the appropriate point in the tail of
the distribution. Choosing a parametric distribution model for the background is
equivalent to specifying the associated parametric probability density function f(x),
where x gives possible pixel values. Once f(x) has been chosen and its parameters
are estimated from the background samples, the probability of false alarm (PFA) for
the threshold T is given by
PFA = 1 −
T
−∞
f (x)dx =
∞
T
f (x)dx
(15.1)
Designing a CFAR detector involves solving the Eq. (15.1) for the threshold T in
terms of the specified PFA and the estimated parameters of the pdf f(x). An analytic
solution to this problem is not always possible and numerical methods may be needed.
One approach is to search for the correct value of T by trial and error.
A commonly used statistical model is the Gaussian distribution. Gaussian distribution is the best approximation due to an increasing of the signal to noise ratio by
resizing SAR images (less time consuming). In this case, the detector is
x t > μ b + σ b t ⇔ TARGET
(15.2)
where x t is the pixel value under test, μ b is the background mean, σ b is the background
standard deviation, and t is a detector design parameter which controls the PFA (or
equivalently the false alarm rate). The Gaussian distribution is not an accurate model
of radar imagery unless the data have been averaged by a large number of looks.
More appropriate models for radar intensity are the negative exponential for single
look imagery and the Gamma distribution for multi-look image. SAR sea clutter is
well modelled by Kν distribution. It is characterised by fast and local fluctuation
(capillary waves) and slower spatial fluctuations due to gravity waves (swell). A
comparison between Gaussian model and K-distributed model on RADARSAT data
is provided in (Brekke et al. 2010). The authors show that the number of false alarms
is reduced by using the K-distribution model.
The following example shows the synergetic use of high resolution earth observation data and satellite based AIS and terrestrial AIS data. Figure 15.12 shows a
TS-X Stripmap mode image in the southern Atlantic Ocean near Cape Town (SA).
Vessels detected by SAR are superimposed and marked with red rectangles. Collocated ships with terrestrial AIS messages are marked by green rectangles. Satellite
AIS is superimposed with yellow rectangles. SAR as well as terrestrial and Satellite
AIS are reporting the same position of targets as can be observed in Fig. 15.12a.
Figure 15.12b shows the general limitation of terrestrial AIS, covering only an area
up to 40 km of the Cape Town area. Three small vessels are detected by SAR. One of
them is reporting an AIS signal via SatAIS. Furthermore, a moving target is visible.
The SAR detected ship reported by SatAIS is moving south.
In the next example, the synergetic use of high-resolution EO data and terrestrial
AIS data is demonstrated in the Street of Gibraltar (Fig. 15.13). Vessels detected