

280
J. M. Magalhaes et al.
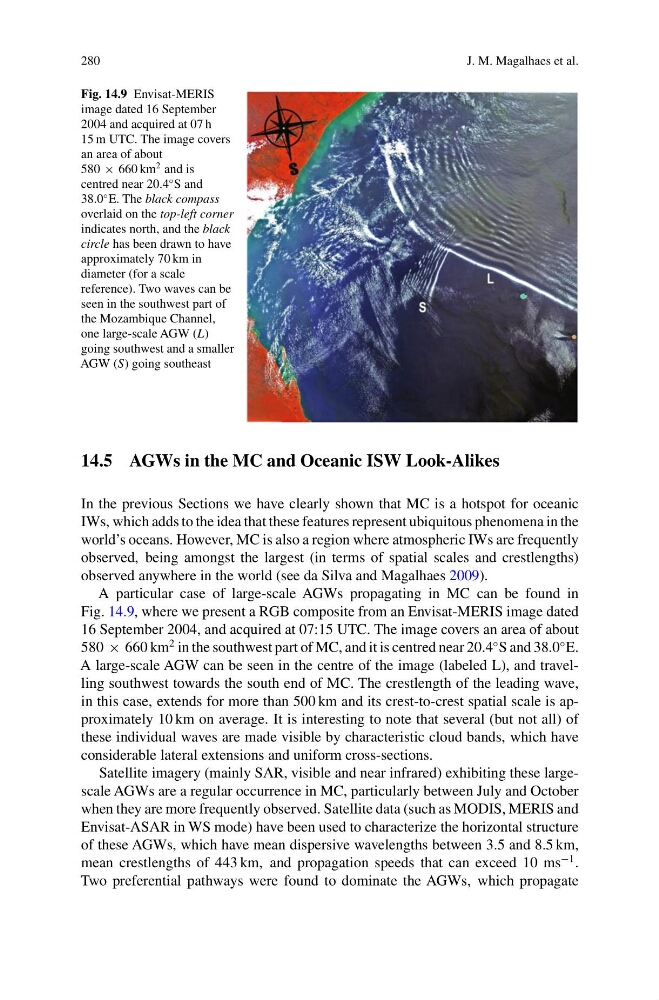
Fig. 14.9 Envisat-MERIS
image dated 16 September
2004 and acquired at 07 h
15 m UTC. The image covers
an area of about
580 × 660 km
2 and is
centred near 20.4
◦ S and
38.0
◦ E. The black compass
overlaid on the top-left corner
indicates north, and the black
circle has been drawn to have
approximately 70 km in
diameter (for a scale
reference). Two waves can be
seen in the southwest part of
the Mozambique Channel,
one large-scale AGW (L)
going southwest and a smaller
AGW (S) going southeast
14.5 AGWs in the MC and Oceanic ISW Look-Alikes
In the previous Sections we have clearly shown that MC is a hotspot for oceanic
IWs, which adds to the idea that these features represent ubiquitous phenomena in the
world’s oceans. However, MC is also a region where atmospheric IWs are frequently
observed, being amongst the largest (in terms of spatial scales and crestlengths)
observed anywhere in the world (see da Silva and Magalhaes 2009).
A particular case of large-scale AGWs propagating in MC can be found in
Fig. 14.9, where we present a RGB composite from an Envisat-MERIS image dated
16 September 2004, and acquired at 07:15 UTC. The image covers an area of about
580 × 660 km
2 in the southwest part of MC, and it is centred near 20.4
◦ S and 38.0
◦ E.
A large-scale AGW can be seen in the centre of the image (labeled L), and travelling southwest towards the south end of MC. The crestlength of the leading wave,
in this case, extends for more than 500 km and its crest-to-crest spatial scale is approximately 10 km on average. It is interesting to note that several (but not all) of
these individual waves are made visible by characteristic cloud bands, which have
considerable lateral extensions and uniform cross-sections.
Satellite imagery (mainly SAR, visible and near infrared) exhibiting these largescale AGWs are a regular occurrence in MC, particularly between July and October
when they are more frequently observed. Satellite data (such as MODIS, MERIS and
Envisat-ASAR in WS mode) have been used to characterize the horizontal structure
of these AGWs, which have mean dispersive wavelengths between 3.5 and 8.5 km,
mean crestlengths of 443 km, and propagation speeds that can exceed 10 ms
−1 .
Two preferential pathways were found to dominate the AGWs, which propagate
J. M. Magalhaes et al.
Fig. 14.9 Envisat-MERIS
image dated 16 September
2004 and acquired at 07 h
15 m UTC. The image covers
an area of about
580 × 660 km
2 and is
centred near 20.4
◦ S and
38.0
◦ E. The black compass
overlaid on the top-left corner
indicates north, and the black
circle has been drawn to have
approximately 70 km in
diameter (for a scale
reference). Two waves can be
seen in the southwest part of
the Mozambique Channel,
one large-scale AGW (L)
going southwest and a smaller
AGW (S) going southeast
14.5 AGWs in the MC and Oceanic ISW Look-Alikes
In the previous Sections we have clearly shown that MC is a hotspot for oceanic
IWs, which adds to the idea that these features represent ubiquitous phenomena in the
world’s oceans. However, MC is also a region where atmospheric IWs are frequently
observed, being amongst the largest (in terms of spatial scales and crestlengths)
observed anywhere in the world (see da Silva and Magalhaes 2009).
A particular case of large-scale AGWs propagating in MC can be found in
Fig. 14.9, where we present a RGB composite from an Envisat-MERIS image dated
16 September 2004, and acquired at 07:15 UTC. The image covers an area of about
580 × 660 km
2 in the southwest part of MC, and it is centred near 20.4
◦ S and 38.0
◦ E.
A large-scale AGW can be seen in the centre of the image (labeled L), and travelling southwest towards the south end of MC. The crestlength of the leading wave,
in this case, extends for more than 500 km and its crest-to-crest spatial scale is approximately 10 km on average. It is interesting to note that several (but not all) of
these individual waves are made visible by characteristic cloud bands, which have
considerable lateral extensions and uniform cross-sections.
Satellite imagery (mainly SAR, visible and near infrared) exhibiting these largescale AGWs are a regular occurrence in MC, particularly between July and October
when they are more frequently observed. Satellite data (such as MODIS, MERIS and
Envisat-ASAR in WS mode) have been used to characterize the horizontal structure
of these AGWs, which have mean dispersive wavelengths between 3.5 and 8.5 km,
mean crestlengths of 443 km, and propagation speeds that can exceed 10 ms
−1 .
Two preferential pathways were found to dominate the AGWs, which propagate