

278
J. M. Magalhaes et al.
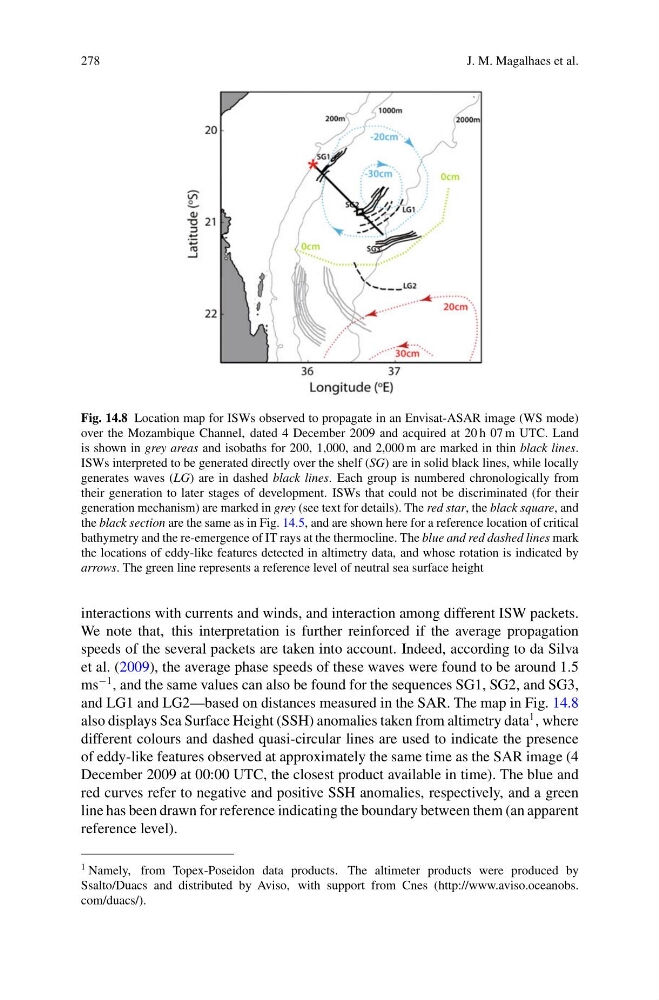
Fig. 14.8 Location map for ISWs observed to propagate in an Envisat-ASAR image (WS mode)
over the Mozambique Channel, dated 4 December 2009 and acquired at 20 h 07 m UTC. Land
is shown in grey areas and isobaths for 200, 1,000, and 2,000 m are marked in thin black lines.
ISWs interpreted to be generated directly over the shelf (SG) are in solid black lines, while locally
generates waves (LG) are in dashed black lines. Each group is numbered chronologically from
their generation to later stages of development. ISWs that could not be discriminated (for their
generation mechanism) are marked in grey (see text for details). The red star, the black square, and
the black section are the same as in Fig. 14.5, and are shown here for a reference location of critical
bathymetry and the re-emergence of IT rays at the thermocline. The blue and red dashed lines mark
the locations of eddy-like features detected in altimetry data, and whose rotation is indicated by
arrows. The green line represents a reference level of neutral sea surface height
interactions with currents and winds, and interaction among different ISW packets.
We note that, this interpretation is further reinforced if the average propagation
speeds of the several packets are taken into account. Indeed, according to da Silva
et al. (2009), the average phase speeds of these waves were found to be around 1.5
ms
−1 , and the same values can also be found for the sequences SG1, SG2, and SG3,
and LG1 and LG2—based on distances measured in the SAR. The map in Fig. 14.8
also displays Sea Surface Height (SSH) anomalies taken from altimetry data
1 , where
different colours and dashed quasi-circular lines are used to indicate the presence
of eddy-like features observed at approximately the same time as the SAR image (4
December 2009 at 00:00 UTC, the closest product available in time). The blue and
red curves refer to negative and positive SSH anomalies, respectively, and a green
line has been drawn for reference indicating the boundary between them (an apparent
reference level).
1 Namely, from Topex-Poseidon data products. The altimeter products were produced by
Ssalto/Duacs and distributed by Aviso, with support from Cnes (http://www.aviso.oceanobs.
com/duacs/).
J. M. Magalhaes et al.
Fig. 14.8 Location map for ISWs observed to propagate in an Envisat-ASAR image (WS mode)
over the Mozambique Channel, dated 4 December 2009 and acquired at 20 h 07 m UTC. Land
is shown in grey areas and isobaths for 200, 1,000, and 2,000 m are marked in thin black lines.
ISWs interpreted to be generated directly over the shelf (SG) are in solid black lines, while locally
generates waves (LG) are in dashed black lines. Each group is numbered chronologically from
their generation to later stages of development. ISWs that could not be discriminated (for their
generation mechanism) are marked in grey (see text for details). The red star, the black square, and
the black section are the same as in Fig. 14.5, and are shown here for a reference location of critical
bathymetry and the re-emergence of IT rays at the thermocline. The blue and red dashed lines mark
the locations of eddy-like features detected in altimetry data, and whose rotation is indicated by
arrows. The green line represents a reference level of neutral sea surface height
interactions with currents and winds, and interaction among different ISW packets.
We note that, this interpretation is further reinforced if the average propagation
speeds of the several packets are taken into account. Indeed, according to da Silva
et al. (2009), the average phase speeds of these waves were found to be around 1.5
ms
−1 , and the same values can also be found for the sequences SG1, SG2, and SG3,
and LG1 and LG2—based on distances measured in the SAR. The map in Fig. 14.8
also displays Sea Surface Height (SSH) anomalies taken from altimetry data
1 , where
different colours and dashed quasi-circular lines are used to indicate the presence
of eddy-like features observed at approximately the same time as the SAR image (4
December 2009 at 00:00 UTC, the closest product available in time). The blue and
red curves refer to negative and positive SSH anomalies, respectively, and a green
line has been drawn for reference indicating the boundary between them (an apparent
reference level).
1 Namely, from Topex-Poseidon data products. The altimeter products were produced by
Ssalto/Duacs and distributed by Aviso, with support from Cnes (http://www.aviso.oceanobs.
com/duacs/).