

276
J. M. Magalhaes et al.
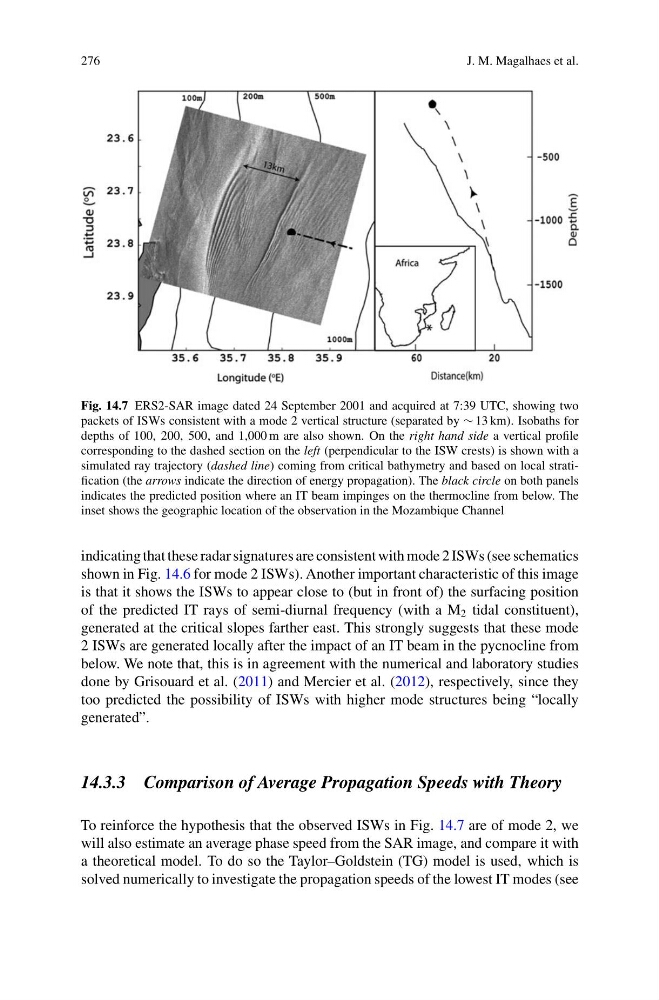
Fig. 14.7 ERS2-SAR image dated 24 September 2001 and acquired at 7:39 UTC, showing two
packets of ISWs consistent with a mode 2 vertical structure (separated by ∼ 13 km). Isobaths for
depths of 100, 200, 500, and 1,000 m are also shown. On the right hand side a vertical profile
corresponding to the dashed section on the left (perpendicular to the ISW crests) is shown with a
simulated ray trajectory (dashed line) coming from critical bathymetry and based on local stratification (the arrows indicate the direction of energy propagation). The black circle on both panels
indicates the predicted position where an IT beam impinges on the thermocline from below. The
inset shows the geographic location of the observation in the Mozambique Channel
indicating that these radar signatures are consistent with mode 2 ISWs (see schematics
shown in Fig. 14.6 for mode 2 ISWs). Another important characteristic of this image
is that it shows the ISWs to appear close to (but in front of) the surfacing position
of the predicted IT rays of semi-diurnal frequency (with a M 2 tidal constituent),
generated at the critical slopes farther east. This strongly suggests that these mode
2 ISWs are generated locally after the impact of an IT beam in the pycnocline from
below. We note that, this is in agreement with the numerical and laboratory studies
done by Grisouard et al. (2011) and Mercier et al. (2012), respectively, since they
too predicted the possibility of ISWs with higher mode structures being “locally
generated”.
14.3.3 Comparison of Average Propagation Speeds with Theory
To reinforce the hypothesis that the observed ISWs in Fig. 14.7 are of mode 2, we
will also estimate an average phase speed from the SAR image, and compare it with
a theoretical model. To do so the Taylor–Goldstein (TG) model is used, which is
solved numerically to investigate the propagation speeds of the lowest IT modes (see
J. M. Magalhaes et al.
Fig. 14.7 ERS2-SAR image dated 24 September 2001 and acquired at 7:39 UTC, showing two
packets of ISWs consistent with a mode 2 vertical structure (separated by ∼ 13 km). Isobaths for
depths of 100, 200, 500, and 1,000 m are also shown. On the right hand side a vertical profile
corresponding to the dashed section on the left (perpendicular to the ISW crests) is shown with a
simulated ray trajectory (dashed line) coming from critical bathymetry and based on local stratification (the arrows indicate the direction of energy propagation). The black circle on both panels
indicates the predicted position where an IT beam impinges on the thermocline from below. The
inset shows the geographic location of the observation in the Mozambique Channel
indicating that these radar signatures are consistent with mode 2 ISWs (see schematics
shown in Fig. 14.6 for mode 2 ISWs). Another important characteristic of this image
is that it shows the ISWs to appear close to (but in front of) the surfacing position
of the predicted IT rays of semi-diurnal frequency (with a M 2 tidal constituent),
generated at the critical slopes farther east. This strongly suggests that these mode
2 ISWs are generated locally after the impact of an IT beam in the pycnocline from
below. We note that, this is in agreement with the numerical and laboratory studies
done by Grisouard et al. (2011) and Mercier et al. (2012), respectively, since they
too predicted the possibility of ISWs with higher mode structures being “locally
generated”.
14.3.3 Comparison of Average Propagation Speeds with Theory
To reinforce the hypothesis that the observed ISWs in Fig. 14.7 are of mode 2, we
will also estimate an average phase speed from the SAR image, and compare it with
a theoretical model. To do so the Taylor–Goldstein (TG) model is used, which is
solved numerically to investigate the propagation speeds of the lowest IT modes (see