

244
M. Krug et al.
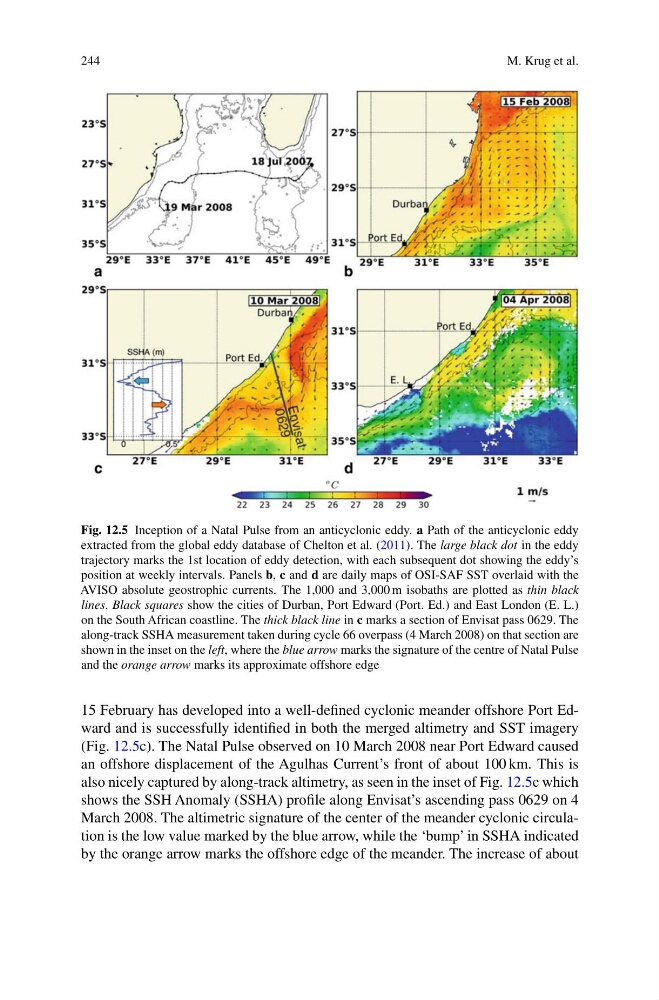
Fig. 12.5 Inception of a Natal Pulse from an anticyclonic eddy. a Path of the anticyclonic eddy
extracted from the global eddy database of Chelton et al. (2011). The large black dot in the eddy
trajectory marks the 1st location of eddy detection, with each subsequent dot showing the eddy’s
position at weekly intervals. Panels b, c and d are daily maps of OSI-SAF SST overlaid with the
AVISO absolute geostrophic currents. The 1,000 and 3,000 m isobaths are plotted as thin black
lines. Black squares show the cities of Durban, Port Edward (Port. Ed.) and East London (E. L.)
on the South African coastline. The thick black line in c marks a section of Envisat pass 0629. The
along-track SSHA measurement taken during cycle 66 overpass (4 March 2008) on that section are
shown in the inset on the left, where the blue arrow marks the signature of the centre of Natal Pulse
and the orange arrow marks its approximate offshore edge
15 February has developed into a well-defined cyclonic meander offshore Port Edward and is successfully identified in both the merged altimetry and SST imagery
(Fig. 12.5c). The Natal Pulse observed on 10 March 2008 near Port Edward caused
an offshore displacement of the Agulhas Current’s front of about 100 km. This is
also nicely captured by along-track altimetry, as seen in the inset of Fig. 12.5c which
shows the SSH Anomaly (SSHA) profile along Envisat’s ascending pass 0629 on 4
March 2008. The altimetric signature of the center of the meander cyclonic circulation is the low value marked by the blue arrow, while the ‘bump’ in SSHA indicated
by the orange arrow marks the offshore edge of the meander. The increase of about
M. Krug et al.
Fig. 12.5 Inception of a Natal Pulse from an anticyclonic eddy. a Path of the anticyclonic eddy
extracted from the global eddy database of Chelton et al. (2011). The large black dot in the eddy
trajectory marks the 1st location of eddy detection, with each subsequent dot showing the eddy’s
position at weekly intervals. Panels b, c and d are daily maps of OSI-SAF SST overlaid with the
AVISO absolute geostrophic currents. The 1,000 and 3,000 m isobaths are plotted as thin black
lines. Black squares show the cities of Durban, Port Edward (Port. Ed.) and East London (E. L.)
on the South African coastline. The thick black line in c marks a section of Envisat pass 0629. The
along-track SSHA measurement taken during cycle 66 overpass (4 March 2008) on that section are
shown in the inset on the left, where the blue arrow marks the signature of the centre of Natal Pulse
and the orange arrow marks its approximate offshore edge
15 February has developed into a well-defined cyclonic meander offshore Port Edward and is successfully identified in both the merged altimetry and SST imagery
(Fig. 12.5c). The Natal Pulse observed on 10 March 2008 near Port Edward caused
an offshore displacement of the Agulhas Current’s front of about 100 km. This is
also nicely captured by along-track altimetry, as seen in the inset of Fig. 12.5c which
shows the SSH Anomaly (SSHA) profile along Envisat’s ascending pass 0629 on 4
March 2008. The altimetric signature of the center of the meander cyclonic circulation is the low value marked by the blue arrow, while the ‘bump’ in SSHA indicated
by the orange arrow marks the offshore edge of the meander. The increase of about