

122
T. Ohde and H. Siegel
The AOD dust data were derived from the aerosol optical depths at 550 nm of MODIS
using the approach of Kaufman et al. (2005). A linear approach between AOD dust
and the surface deposition was used (see e.g. Kaufman et al. 2005).
Area-averaged means were calculated from 8d means of the geophysical variables
AOD dust , Chl-a and τ v . The signals of yearly cycle of AOD dust , Chl-a and τ v were
eliminated by the determination of anomalies. The seasonal means of time period
from 2000 to 2008 were subtracted from each area-averaged 8d mean data point.
The anomalies were averaged over three month to eliminate fluctuations.
The generated time series of anomalies were analyzed by cross- and multiple
correlations to get potential relations between the geophysical variables AOD dust ,
Chl-a, and τ v. The cross-correlation establishes the degree to which two time series
are correlated and the potential time lag between cause and effect. Multiple correlation evaluates the contribution of each independent process to the variability of the
dependent variable. Detailed information’s about the used methods were given in
Ohde and Siegel (2010).
The derived time series of area-averaged means were used to determine all strong
Saharan dust storms in the time period from 2000 to 2008. The identified storms were
investigated whether there was an increase in the Chl-a concentrations that could have
been caused by the dust storm. The Chl-a concentration could also be influenced by
intensified coastal upwelling because of the increased alongshore wind stress during
storms. Therefore, the dataset of τ v was searched for constant or decreased values
during dust storms. The increase in the Chl-a concentration of such events should be
related to nutrient supply by dust input, but not by coastal upwelling.
6.2.2 Methods in Relation to Dust Impact on PAR
6.2.2.1 Optical Model Description
The influence of Saharan dust on PAR in the water column was investigated with
an optical model which separated the effects of dust on the amount and the spectral
distribution of the incident radiation. This optical model was introduced here shortly
because the detailed description was given in Ohde and Siegel (2012b). The influence
of dust on the magnitude of PAR was studied with the relation
Δ m Q PAR (z)
Q PAR (z, N = 1, S = 1)
=
Q PAR (z) − Q PAR (z, N = 1, S = 1)
Q PAR (z, N = 1, S = 1)
∗ 100%
(6.1)
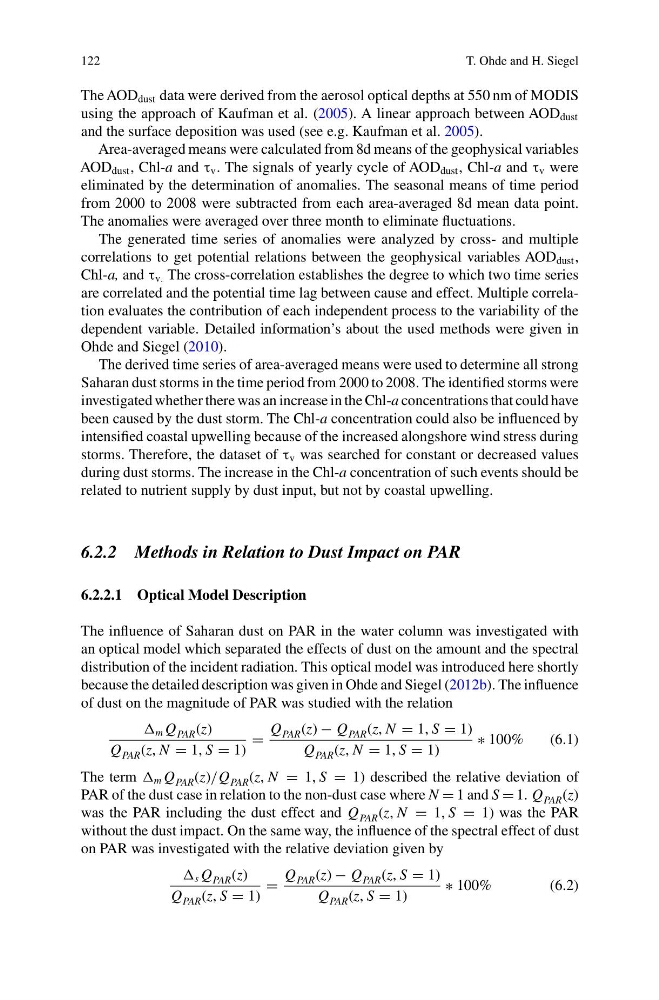
The term Δ m Q PAR (z)/Q PAR (z, N = 1, S = 1) described the relative deviation of
PAR of the dust case in relation to the non-dust case where N = 1 and S = 1. Q PAR (z)
was the PAR including the dust effect and Q PAR (z, N = 1, S = 1) was the PAR
without the dust impact. On the same way, the influence of the spectral effect of dust
on PAR was investigated with the relative deviation given by
Δ s Q PAR (z)
Q PAR (z, S = 1)
=
Q PAR (z) − Q PAR (z, S = 1)
Q PAR (z, S = 1)
∗ 100%
(6.2)
T. Ohde and H. Siegel
The AOD dust data were derived from the aerosol optical depths at 550 nm of MODIS
using the approach of Kaufman et al. (2005). A linear approach between AOD dust
and the surface deposition was used (see e.g. Kaufman et al. 2005).
Area-averaged means were calculated from 8d means of the geophysical variables
AOD dust , Chl-a and τ v . The signals of yearly cycle of AOD dust , Chl-a and τ v were
eliminated by the determination of anomalies. The seasonal means of time period
from 2000 to 2008 were subtracted from each area-averaged 8d mean data point.
The anomalies were averaged over three month to eliminate fluctuations.
The generated time series of anomalies were analyzed by cross- and multiple
correlations to get potential relations between the geophysical variables AOD dust ,
Chl-a, and τ v. The cross-correlation establishes the degree to which two time series
are correlated and the potential time lag between cause and effect. Multiple correlation evaluates the contribution of each independent process to the variability of the
dependent variable. Detailed information’s about the used methods were given in
Ohde and Siegel (2010).
The derived time series of area-averaged means were used to determine all strong
Saharan dust storms in the time period from 2000 to 2008. The identified storms were
investigated whether there was an increase in the Chl-a concentrations that could have
been caused by the dust storm. The Chl-a concentration could also be influenced by
intensified coastal upwelling because of the increased alongshore wind stress during
storms. Therefore, the dataset of τ v was searched for constant or decreased values
during dust storms. The increase in the Chl-a concentration of such events should be
related to nutrient supply by dust input, but not by coastal upwelling.
6.2.2 Methods in Relation to Dust Impact on PAR
6.2.2.1 Optical Model Description
The influence of Saharan dust on PAR in the water column was investigated with
an optical model which separated the effects of dust on the amount and the spectral
distribution of the incident radiation. This optical model was introduced here shortly
because the detailed description was given in Ohde and Siegel (2012b). The influence
of dust on the magnitude of PAR was studied with the relation
Δ m Q PAR (z)
Q PAR (z, N = 1, S = 1)
=
Q PAR (z) − Q PAR (z, N = 1, S = 1)
Q PAR (z, N = 1, S = 1)
∗ 100%
(6.1)
The term Δ m Q PAR (z)/Q PAR (z, N = 1, S = 1) described the relative deviation of
PAR of the dust case in relation to the non-dust case where N = 1 and S = 1. Q PAR (z)
was the PAR including the dust effect and Q PAR (z, N = 1, S = 1) was the PAR
without the dust impact. On the same way, the influence of the spectral effect of dust
on PAR was investigated with the relative deviation given by
Δ s Q PAR (z)
Q PAR (z, S = 1)
=
Q PAR (z) − Q PAR (z, S = 1)
Q PAR (z, S = 1)
∗ 100%
(6.2)