

4.1. Basic Model
59
Summer
o Total_Population
Standard
FIGURE 4.6
To calculate the total size of the population, you must add all three
stocks. You can simply generate a new converter, call it TOTAL POPULATION, and specify it as a "Summer" by checking the respective box in the
dialog window (Figure 4.6). Then select each of the three stocks, and
STELLA will automatically add their values . The Summer function enables
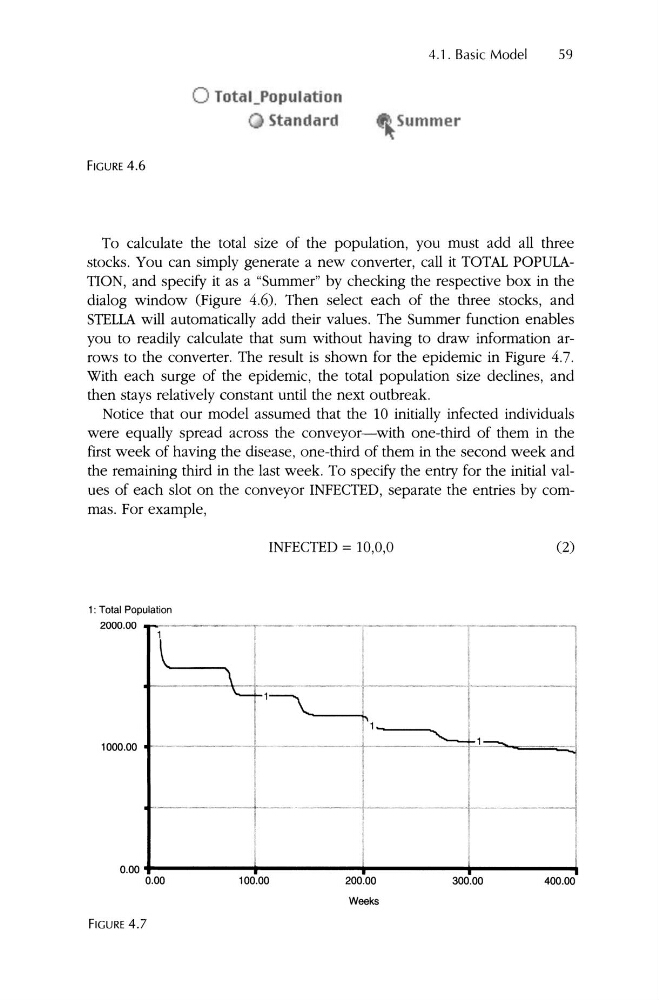
you to readily calculate that sum without having to draw information arrows to the converter. The result is shown for the epidemic in Figure 4.7.
With each surge of the epidemic, the total population size declines, and
then stays relatively constant until the next outbreak.
Notice that our model assumed that the 10 initially infected individuals
were equally spread across the conveyor-with one-third of them in the
first week of having the disease , one-third of them in the second week and
the remaining third in the last week. To specify the entry for the initial values of each slot on the conveyor INFECTED, separate the entries by commas. For example,
INFECTED = 10,0,0
(2)
1: Total Populat ion
2000.00
'\
\.
1
<,
1000.00
. I
200.00
Weeks
100.00
300.00
400.00
0.00
0.00
FIGURE 4.7
59
Summer
o Total_Population
Standard
FIGURE 4.6
To calculate the total size of the population, you must add all three
stocks. You can simply generate a new converter, call it TOTAL POPULATION, and specify it as a "Summer" by checking the respective box in the
dialog window (Figure 4.6). Then select each of the three stocks, and
STELLA will automatically add their values . The Summer function enables
you to readily calculate that sum without having to draw information arrows to the converter. The result is shown for the epidemic in Figure 4.7.
With each surge of the epidemic, the total population size declines, and
then stays relatively constant until the next outbreak.
Notice that our model assumed that the 10 initially infected individuals
were equally spread across the conveyor-with one-third of them in the
first week of having the disease , one-third of them in the second week and
the remaining third in the last week. To specify the entry for the initial values of each slot on the conveyor INFECTED, separate the entries by commas. For example,
INFECTED = 10,0,0
(2)
1: Total Populat ion
2000.00
'\
\.
1
<,
1000.00
. I
200.00
Weeks
100.00
300.00
400.00
0.00
0.00
FIGURE 4.7