

2.2. Closing a Model
29
This model of whale dynamics with a nonlinear relation between population size and reproduction rate has no analytic solution , only a numerical
one . Only when the graph in Figure 2.10 is a straight line is there an analytic solution to the problem .
We can study the sensitivity of the answer to changes in our assumption
about the relation between population size and rate of reproduction. Simply change the graph and run the model again, then compare the result
against the previous model runs .
Admittedly, the model above is rather simple. Actually, you should always start with a simple model and keep it simple, especially at first. Whenever possible , compare your model inputs and results against measured
values . For example, find published data on humpback whale reproduction
rates, densities, and density changes through time. Complicate your model
only when your results do not match the available data with sufficient accuracy, or when your model does not yet include all the features of the real
system that you wish to capture. For example, we know that humpback
whale populations, like many other marine animals, are subject to mortality
due to a range of natural and anthropogenic causes . What are the whale
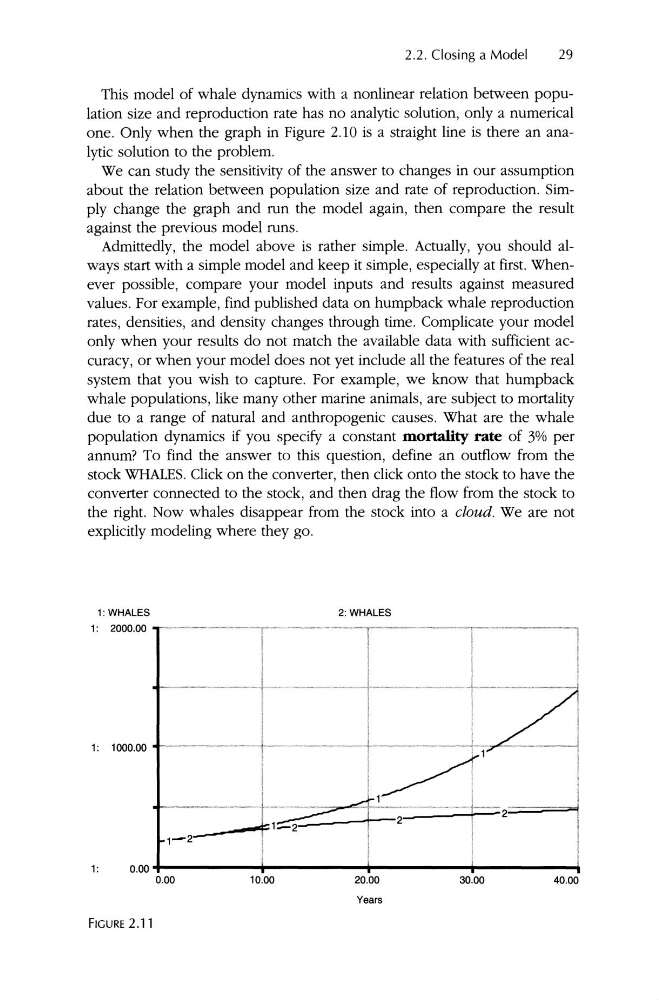
population dynamics if you specify a constant mortality rate of 3% per
annum? To find the answer to this question, define an outflow from the
stock WHALES. Click on the converter, then click onto the stock to have the
converter connected to the stock, and then drag the flow from the stock to
the right. Now whales disappear from the stock into a cloud. We are not
explicitly modeling where they go.
1: WHALES
1: 2000.00
2: WHALES
1: 1000.00
1:
0.00 +0.00
------+-----~r
20.00
_-----+_----10.00
30.00
Years
...
FIGURE 2.11
29
This model of whale dynamics with a nonlinear relation between population size and reproduction rate has no analytic solution , only a numerical
one . Only when the graph in Figure 2.10 is a straight line is there an analytic solution to the problem .
We can study the sensitivity of the answer to changes in our assumption
about the relation between population size and rate of reproduction. Simply change the graph and run the model again, then compare the result
against the previous model runs .
Admittedly, the model above is rather simple. Actually, you should always start with a simple model and keep it simple, especially at first. Whenever possible , compare your model inputs and results against measured
values . For example, find published data on humpback whale reproduction
rates, densities, and density changes through time. Complicate your model
only when your results do not match the available data with sufficient accuracy, or when your model does not yet include all the features of the real
system that you wish to capture. For example, we know that humpback
whale populations, like many other marine animals, are subject to mortality
due to a range of natural and anthropogenic causes . What are the whale
population dynamics if you specify a constant mortality rate of 3% per
annum? To find the answer to this question, define an outflow from the
stock WHALES. Click on the converter, then click onto the stock to have the
converter connected to the stock, and then drag the flow from the stock to
the right. Now whales disappear from the stock into a cloud. We are not
explicitly modeling where they go.
1: WHALES
1: 2000.00
2: WHALES
1: 1000.00
1:
0.00 +0.00
------+-----~r
20.00
_-----+_----10.00
30.00
Years
...
FIGURE 2.11