

2.1 . Basic Population Model
23
Next, we must decide what factors control (Le. add to or subtract from)
the number of whales in the population. If we assume that the whales in
our population never die, we have one control variable: REPRODUCTION.
We use the flow tool (the right-pointing arrow , second from the left in Figure 2.2) to represent the control variable, so named because it controls the
states (variables) . Click on the flow symbol ; then click on a point about 2
inches to the left of the rectangle (stock) and drag the arrow to WHALES,
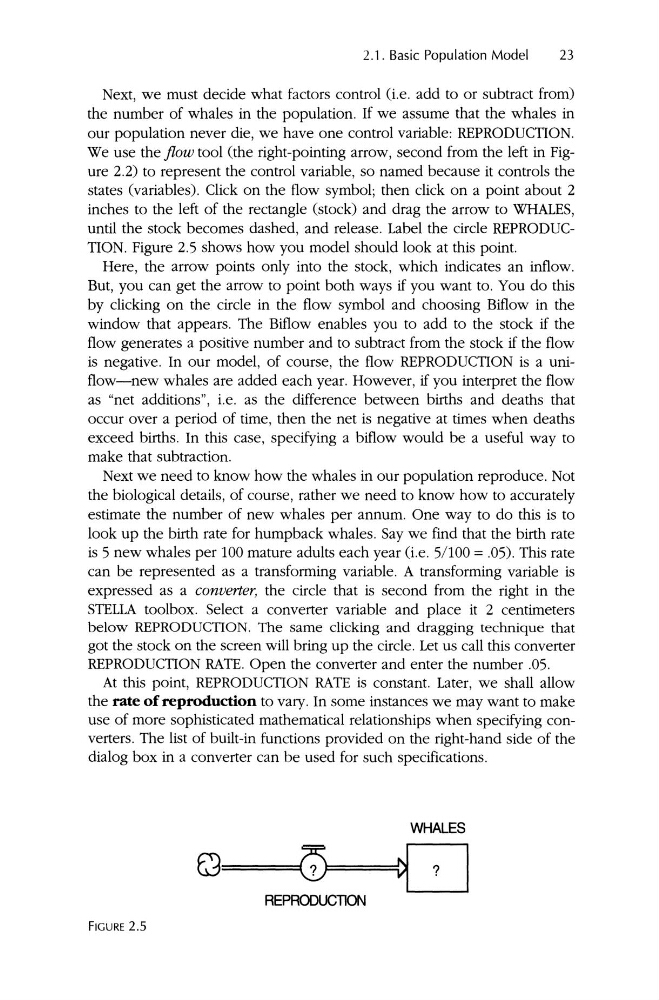
until the stock becomes dashed, and release . Label the circle REPRODUCTION. Figure 2.5 shows how you model should look at this point.
Here, the arrow points only into the stock, which indicates an inflow.
But, you can get the arrow to point both ways if you want to. You do this
by clicking on the circle in the flow symbol and choosing Biflow in the
window that appears. The Biflow enables you to add to the stock if the
flow generates a positive number and to subtract from the stock if the flow
is negative. In our model, of course, the flow REPRODUCTION is a uniflow-new whales are added each year . However, if you interpret the flow
as "net additions", i.e. as the difference between births and deaths that
occur over a period of time, then the net is negative at times when deaths
exceed births . In this case, specifying a biflow would be a useful way to
make that subtraction.
Next we need to know how the whales in our population reproduce. Not
the biological details, of course , rather we need to know how to accurately
estimate the number of new whales per annum. One way to do this is to
look up the birth rate for humpback whales. Say we find that the birth rate
is 5 new whales per 100 mature adults each year (i.e. 5/100 = .05). This rate
can be represented as a transforming variable . A transforming variable is
expressed as a converter, the circle that is second from the right in the
STELLA toolbox. Select a converter variable and place it 2 centimeters
below REPRODUCTION. The same clicking and dragging technique that
got the stock on the screen will bring up the circle. Let us call this converter
REPRODUCTION RATE. Open the converter and enter the number .05.
At this point, REPRODUCTION RATE is constant. Later, we shall allow
the rate of reproduction to vary. In some instances we may want to make
use of more sophisticated mathematical relationships when specifying converters . The list of built-in functions provided on the right-hand side of the
dialog box in a converter can be used for such specifications .
WHALES
REPRODUCllON
FIGURE 2.5
23
Next, we must decide what factors control (Le. add to or subtract from)
the number of whales in the population. If we assume that the whales in
our population never die, we have one control variable: REPRODUCTION.
We use the flow tool (the right-pointing arrow , second from the left in Figure 2.2) to represent the control variable, so named because it controls the
states (variables) . Click on the flow symbol ; then click on a point about 2
inches to the left of the rectangle (stock) and drag the arrow to WHALES,
until the stock becomes dashed, and release . Label the circle REPRODUCTION. Figure 2.5 shows how you model should look at this point.
Here, the arrow points only into the stock, which indicates an inflow.
But, you can get the arrow to point both ways if you want to. You do this
by clicking on the circle in the flow symbol and choosing Biflow in the
window that appears. The Biflow enables you to add to the stock if the
flow generates a positive number and to subtract from the stock if the flow
is negative. In our model, of course, the flow REPRODUCTION is a uniflow-new whales are added each year . However, if you interpret the flow
as "net additions", i.e. as the difference between births and deaths that
occur over a period of time, then the net is negative at times when deaths
exceed births . In this case, specifying a biflow would be a useful way to
make that subtraction.
Next we need to know how the whales in our population reproduce. Not
the biological details, of course , rather we need to know how to accurately
estimate the number of new whales per annum. One way to do this is to
look up the birth rate for humpback whales. Say we find that the birth rate
is 5 new whales per 100 mature adults each year (i.e. 5/100 = .05). This rate
can be represented as a transforming variable . A transforming variable is
expressed as a converter, the circle that is second from the right in the
STELLA toolbox. Select a converter variable and place it 2 centimeters
below REPRODUCTION. The same clicking and dragging technique that
got the stock on the screen will bring up the circle. Let us call this converter
REPRODUCTION RATE. Open the converter and enter the number .05.
At this point, REPRODUCTION RATE is constant. Later, we shall allow
the rate of reproduction to vary. In some instances we may want to make
use of more sophisticated mathematical relationships when specifying converters . The list of built-in functions provided on the right-hand side of the
dialog box in a converter can be used for such specifications .
WHALES
REPRODUCllON
FIGURE 2.5