

1000
1000
1000
1000
1000
1000
1000
1000
1000
1000
0,1
0.2
0.3
0.4
0.5
0,6
0,7
0.8
0.9
1
348
15. Fish Popu lation Responses to Sea Floor H abitat Alteration
15.4. Model Results
Results of the model are displayed as three-dimensional response surfaces to
investigate the co-variation of key parameters in the model. Data are first collected using the Table function in STELLA. For each model run, the endpoint, or last cell in the column , indicates the number of juvenile fish surviving at the end of the 12-month period . This number can be exported to the
spreadsheet. In the spreadsheet, movement rate and settlement density (e.g.
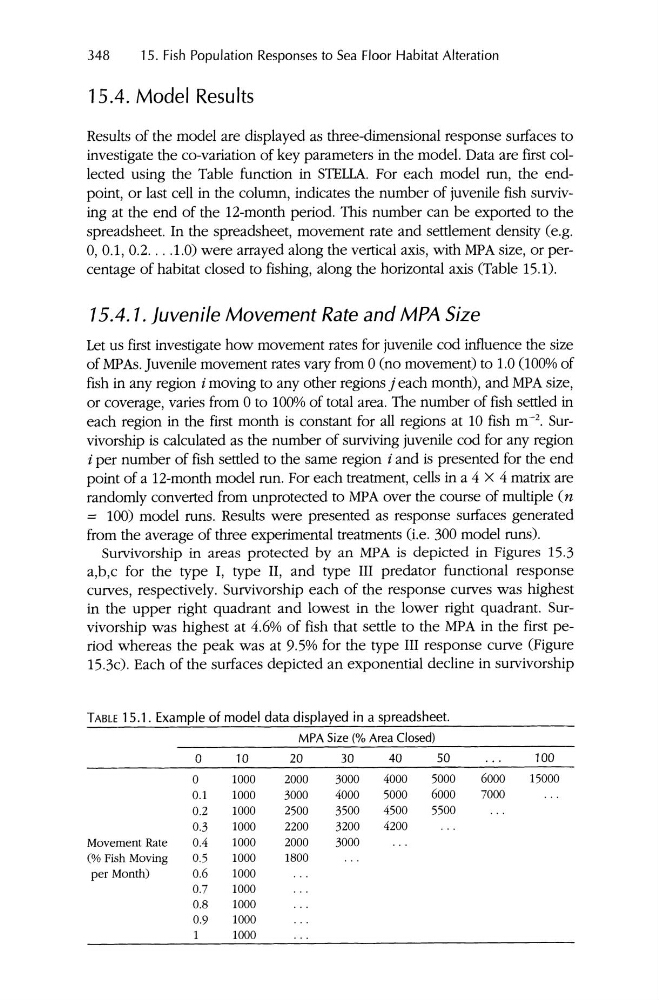
0,0.1,0.2....1.0) were arrayed along the vertical axis, with MPA size, or percentage of habitat closed to fishing, along the horizontal axis (Table 15.1).
15.4.1 . Juvenile Movement Rate and MPA Size
Let us first investigate how movement rates for juvenile cod influence the size
of MPAs.Juvenile movement rates vary from 0 (no movement) to 1.0 (lOOo,,1J of
fish in any region i moving to any other regions j each month), and MPA size,
or coverage, varies from 0 to 100% of total area. The number of fish settled in
each region in the first month is constant for all regions at 10 fish m" , Survivorship is calculated as the number of surviving juvenile cod for any region
i per number of fish settled to the same region i and is presented for the end
point of a 12-month model run. For each treatment, cells in a 4 X 4 matrix are
randomly converted from unprotected to MPA over the course of multiple (n
= 100) model runs. Results were presented as respons e surfaces generated
from the average of three experimental treatments (i.e. 300 model runs).
Survivorship in areas protected by an MPA is depicted in Figures 15.3
a,b,c for the type I, type II, and type III predator functional response
curves , respectively. Survivorship each of the response curves was highest
in the upper right quadrant and lowest in the lower right quadrant. Survivorship was highest at 4.6% of fish that settle to the MPA in the first period whereas the peak was at 9.5% for the type III response curve (Figure
15.3c). Each of the surfaces depicted an exponential decline in survivorship
T ABLE 15.1 . Example of mod el data displayed in a spreadsheet.
MPA Size(% Area Closed)
0
10
20
30
40
SO
100
0
1000
2000
3000
4000
5000
6000
15000
7000
6000
5500
5000
4500
4200
4000
3500
3200
3000
3000
2500
2200
2000
1800
Movement Rate
(% Fish Moving
per Month)
1000
1000
1000
1000
1000
1000
1000
1000
1000
0,1
0.2
0.3
0.4
0.5
0,6
0,7
0.8
0.9
1
348
15. Fish Popu lation Responses to Sea Floor H abitat Alteration
15.4. Model Results
Results of the model are displayed as three-dimensional response surfaces to
investigate the co-variation of key parameters in the model. Data are first collected using the Table function in STELLA. For each model run, the endpoint, or last cell in the column , indicates the number of juvenile fish surviving at the end of the 12-month period . This number can be exported to the
spreadsheet. In the spreadsheet, movement rate and settlement density (e.g.
0,0.1,0.2....1.0) were arrayed along the vertical axis, with MPA size, or percentage of habitat closed to fishing, along the horizontal axis (Table 15.1).
15.4.1 . Juvenile Movement Rate and MPA Size
Let us first investigate how movement rates for juvenile cod influence the size
of MPAs.Juvenile movement rates vary from 0 (no movement) to 1.0 (lOOo,,1J of
fish in any region i moving to any other regions j each month), and MPA size,
or coverage, varies from 0 to 100% of total area. The number of fish settled in
each region in the first month is constant for all regions at 10 fish m" , Survivorship is calculated as the number of surviving juvenile cod for any region
i per number of fish settled to the same region i and is presented for the end
point of a 12-month model run. For each treatment, cells in a 4 X 4 matrix are
randomly converted from unprotected to MPA over the course of multiple (n
= 100) model runs. Results were presented as respons e surfaces generated
from the average of three experimental treatments (i.e. 300 model runs).
Survivorship in areas protected by an MPA is depicted in Figures 15.3
a,b,c for the type I, type II, and type III predator functional response
curves , respectively. Survivorship each of the response curves was highest
in the upper right quadrant and lowest in the lower right quadrant. Survivorship was highest at 4.6% of fish that settle to the MPA in the first period whereas the peak was at 9.5% for the type III response curve (Figure
15.3c). Each of the surfaces depicted an exponential decline in survivorship
T ABLE 15.1 . Example of mod el data displayed in a spreadsheet.
MPA Size(% Area Closed)
0
10
20
30
40
SO
100
0
1000
2000
3000
4000
5000
6000
15000
7000
6000
5500
5000
4500
4200
4000
3500
3200
3000
3000
2500
2200
2000
1800
Movement Rate
(% Fish Moving
per Month)