

14.4. Results
325
Council from 1995 onward . As a result, effort is allowed to increase until
1995, decrease annually by 10 percent from there on and is not allowed in
the future to surpass effort levels achieved in 2000. The changes in the relative sizes of the three populations are shown in Figure 14.5. Cod and haddock decline, while pollock becomes the dominant species.
When run under the assumption of an enactment of the above management measures in 1995, the model exhibits loss of at least one population
within a time frame that is shorter than if those measures had not been
implemented. The shorter time frame is due to an earlier loss of haddock
from the ecosystem. Even though fishing effort is reduced, the resulting
density-dependent effects cause a dominance by pollock at the expense of
haddock.
Similar results are found for an increase in mesh size. An increase in
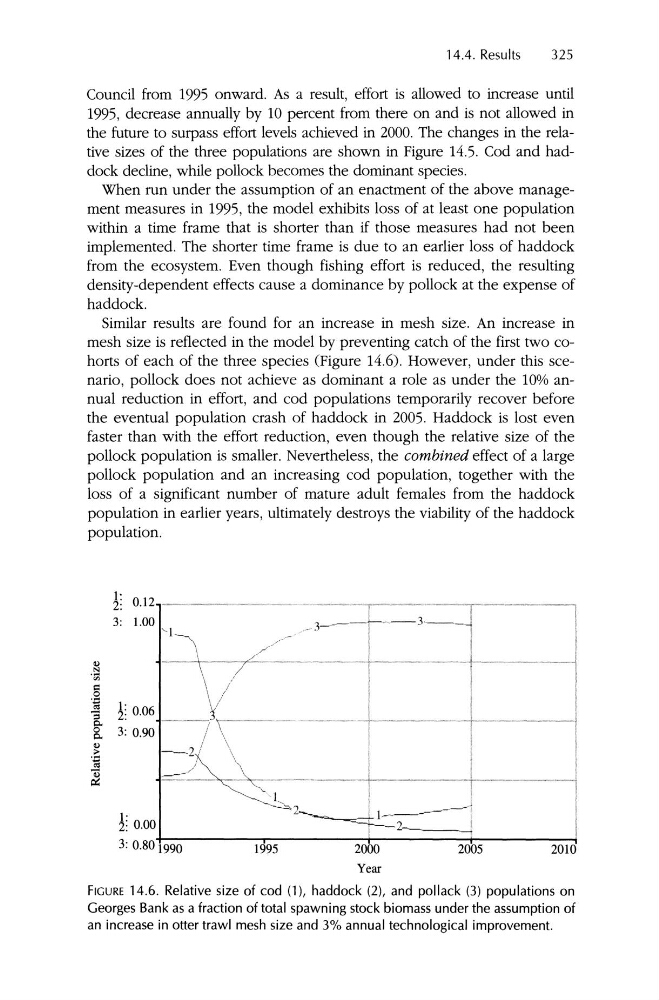
mesh size is reflected in the model by preventing catch of the first two cohorts of each of the three species (Figure 14.6). However, under this scenario , pollock does not achieve as dominant a role as under the 10% annual reduction in effort, and cod populations temporarily recover before
the eventual population crash of haddock in 2005. Haddock is lost even
faster than with the effort reduction, even though the relative size of the
pollock population is smaller. Nevertheless, the combined effect of a large
pollock population and an increasing cod population, together with the
loss of a significant number of mature adult females from the haddock
population in earlier years, ultimately destroys the viability of the haddock
population.
1: 0.00
3: 0. 8 0 + 1 9 - 9 - 0 - - - - - r - - - - - - - t - - - - - + - - - - - - - - l
1995
2000
2005
2010
Year
FIGURE 14.6. Relative size of cod (1), haddock (2), and pollack (3) populations on
Georges Bank as a fraction of total spawning stock biomass under the assumption of
an increase in otter trawl mesh size and 3% annual technological improvement.
325
Council from 1995 onward . As a result, effort is allowed to increase until
1995, decrease annually by 10 percent from there on and is not allowed in
the future to surpass effort levels achieved in 2000. The changes in the relative sizes of the three populations are shown in Figure 14.5. Cod and haddock decline, while pollock becomes the dominant species.
When run under the assumption of an enactment of the above management measures in 1995, the model exhibits loss of at least one population
within a time frame that is shorter than if those measures had not been
implemented. The shorter time frame is due to an earlier loss of haddock
from the ecosystem. Even though fishing effort is reduced, the resulting
density-dependent effects cause a dominance by pollock at the expense of
haddock.
Similar results are found for an increase in mesh size. An increase in
mesh size is reflected in the model by preventing catch of the first two cohorts of each of the three species (Figure 14.6). However, under this scenario , pollock does not achieve as dominant a role as under the 10% annual reduction in effort, and cod populations temporarily recover before
the eventual population crash of haddock in 2005. Haddock is lost even
faster than with the effort reduction, even though the relative size of the
pollock population is smaller. Nevertheless, the combined effect of a large
pollock population and an increasing cod population, together with the
loss of a significant number of mature adult females from the haddock
population in earlier years, ultimately destroys the viability of the haddock
population.
1: 0.00
3: 0. 8 0 + 1 9 - 9 - 0 - - - - - r - - - - - - - t - - - - - + - - - - - - - - l
1995
2000
2005
2010
Year
FIGURE 14.6. Relative size of cod (1), haddock (2), and pollack (3) populations on
Georges Bank as a fraction of total spawning stock biomass under the assumption of
an increase in otter trawl mesh size and 3% annual technological improvement.