

236
12. Kelp, Urchins, and Otters in the California Coastal Region
TABLE 12.1. Initial Urchin Distribution (extrapolated
from a graph in Estes and Duggins, 1995).
Test Size Range
(mm)
0-5
6-10
11-15
16-20
21-25
26-30
31-35
36-40
41-45
46-50
51-55
56-60
60+
Total
Initial Percentage
of Urchins in Cohort
]00
12
35
12
5
3
2
3
5
11
5
2
1
4
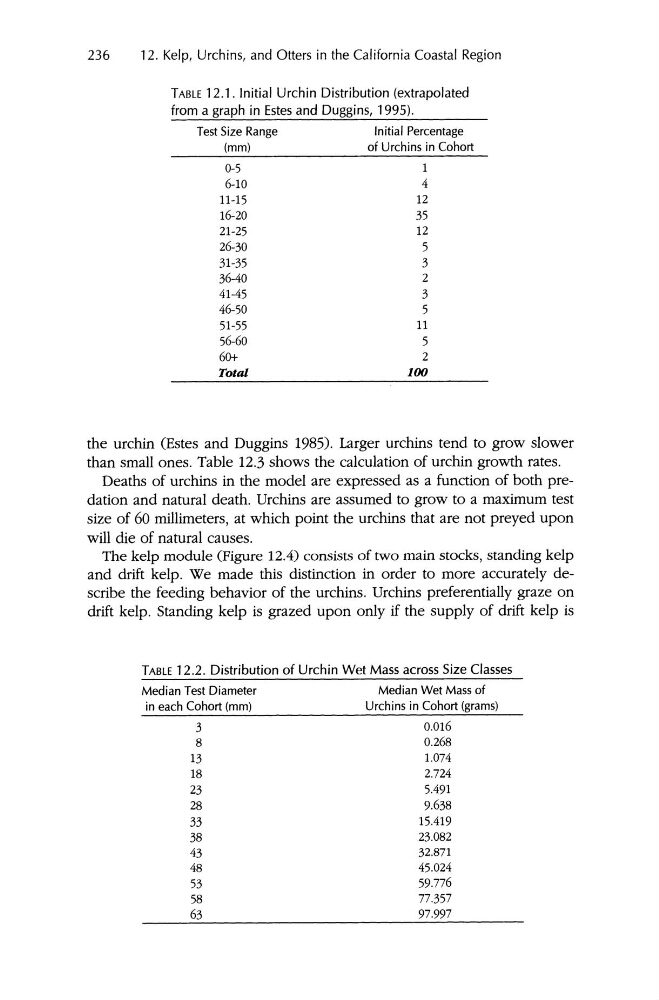
the urchin (Estes and Duggins 1985), Larger urchins tend to grow slower
than small ones. Table 12.3 shows the calculation of urchin growth rates.
Deaths of urchins in the model are expressed as a function of both predation and natural death. Urchins are assumed to grow to a maximum test
size of 60 millimeters, at which point the urchins that are not preyed upon
will die of natural causes.
The kelp module (Figure 12 .4) consists of two main stocks, standing kelp
and drift kelp . We made this distinction in order to more accurately describe the feeding behavior of the urchins. Urchins preferentially graze on
drift kelp . Standing kelp is grazed upon only if the supply of drift kelp is
T ABLE 12.2. Distribution of Urchin Wet Mass across Size Classes
Median Wet M ass of
Urchins in Cohort (grams)
0.016
0.268
1.074
2.724
5.491
9.638
15.419
23.082
32.871
45.024
59.776
77.357
97.997
Median Test Diameter
in each Cohort (mm)
3
8
13
18
23
28
33
38
43
48
53
58
63
12. Kelp, Urchins, and Otters in the California Coastal Region
TABLE 12.1. Initial Urchin Distribution (extrapolated
from a graph in Estes and Duggins, 1995).
Test Size Range
(mm)
0-5
6-10
11-15
16-20
21-25
26-30
31-35
36-40
41-45
46-50
51-55
56-60
60+
Total
Initial Percentage
of Urchins in Cohort
]00
12
35
12
5
3
2
3
5
11
5
2
1
4
the urchin (Estes and Duggins 1985), Larger urchins tend to grow slower
than small ones. Table 12.3 shows the calculation of urchin growth rates.
Deaths of urchins in the model are expressed as a function of both predation and natural death. Urchins are assumed to grow to a maximum test
size of 60 millimeters, at which point the urchins that are not preyed upon
will die of natural causes.
The kelp module (Figure 12 .4) consists of two main stocks, standing kelp
and drift kelp . We made this distinction in order to more accurately describe the feeding behavior of the urchins. Urchins preferentially graze on
drift kelp . Standing kelp is grazed upon only if the supply of drift kelp is
T ABLE 12.2. Distribution of Urchin Wet Mass across Size Classes
Median Wet M ass of
Urchins in Cohort (grams)
0.016
0.268
1.074
2.724
5.491
9.638
15.419
23.082
32.871
45.024
59.776
77.357
97.997
Median Test Diameter
in each Cohort (mm)
3
8
13
18
23
28
33
38
43
48
53
58
63