

234
12. Kelp, Urchins, and Otters in the California Coastal Region
Carrying Cap
Ave Wt Adult Male
Adult Male Eat per Month
Total kg Eaten Per Month @----+O
Kg Urchin consumed
Adult Female Eat per Month
Total Otter Females Total Otter Males
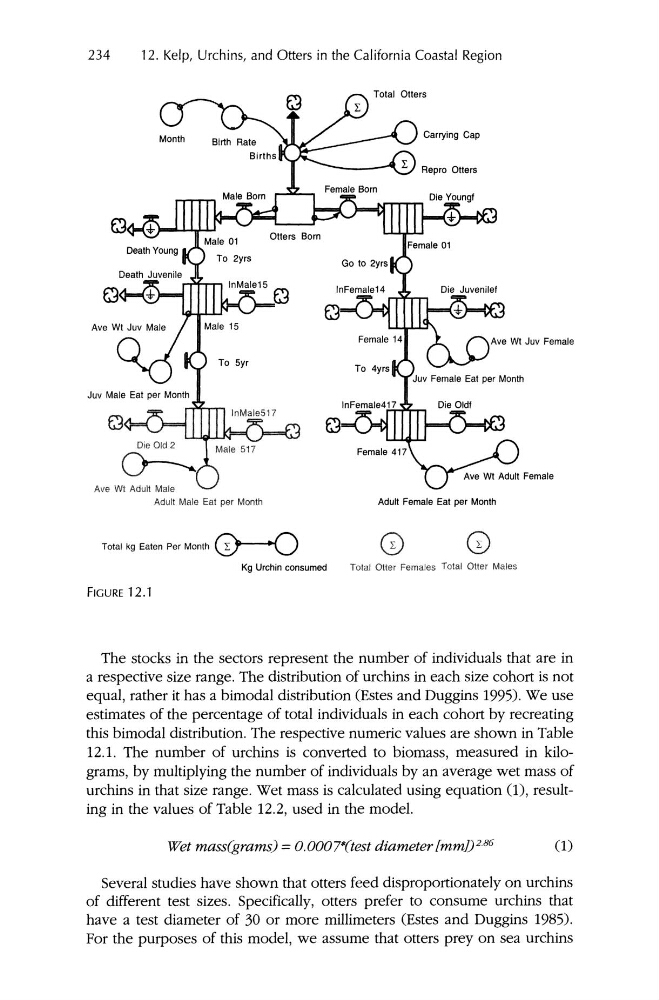
FIGURE 12.1
The stocks in the sectors represent the number of individuals that are in
a respective size range . The distribution of urchins in each size cohort is not
equal, rather it has a bimodal distribution (Estes and Duggins 1995). We use
estimates of the percentage of total individuals in each cohort by recreating
this bimodal distribution. The respective numeric values are shown in Table
12.1. The number of urchins is converted to biomass, measured in kilograms, by multiplying the number of individuals by an average wet mass of
urchins in that size range . Wet mass is calculated using equation 0), resulting in the values of Table 12.2, used in the model.
Wet massigrams) =o.0007*(testdiameter [mmJJ286
(1)
Several studies have shown that otters feed disproportionately on urchins
of different test sizes. Specifically, otters prefer to consume urchins that
have a test diameter of 30 or more millimeters (Estes and Duggins 1985).
For the purposes of this model, we assume that otters prey on sea urchins
12. Kelp, Urchins, and Otters in the California Coastal Region
Carrying Cap
Ave Wt Adult Male
Adult Male Eat per Month
Total kg Eaten Per Month @----+O
Kg Urchin consumed
Adult Female Eat per Month
Total Otter Females Total Otter Males
FIGURE 12.1
The stocks in the sectors represent the number of individuals that are in
a respective size range . The distribution of urchins in each size cohort is not
equal, rather it has a bimodal distribution (Estes and Duggins 1995). We use
estimates of the percentage of total individuals in each cohort by recreating
this bimodal distribution. The respective numeric values are shown in Table
12.1. The number of urchins is converted to biomass, measured in kilograms, by multiplying the number of individuals by an average wet mass of
urchins in that size range . Wet mass is calculated using equation 0), resulting in the values of Table 12.2, used in the model.
Wet massigrams) =o.0007*(testdiameter [mmJJ286
(1)
Several studies have shown that otters feed disproportionately on urchins
of different test sizes. Specifically, otters prefer to consume urchins that
have a test diameter of 30 or more millimeters (Estes and Duggins 1985).
For the purposes of this model, we assume that otters prey on sea urchins