

10.4. Concl usions
205
TABLE 10.2. Effects of patch size on recovery time. Recovery ti me is given for 2
species in various patch sizes; results are from model simulatio ns run w ith juvenile
and adult advecti on set equal to each other at (a) 0.25 and (b) 0.75.
(a)
Patch size
(r=radius)
Nepthys recovery time
(weeks)
Polydora recovery time
(weeks)
Small (r=2)
Medium (r=20)
Large (r=200)
6
30
82
3
6
6
(b)
Patch size
(r=radius)
Nepthys recovery time
(weeks)
Polydora recovery time
(weeks)
Small (r=2)
Mediu m (r=20)
Large (r=200)
2
14
67
2
5
6
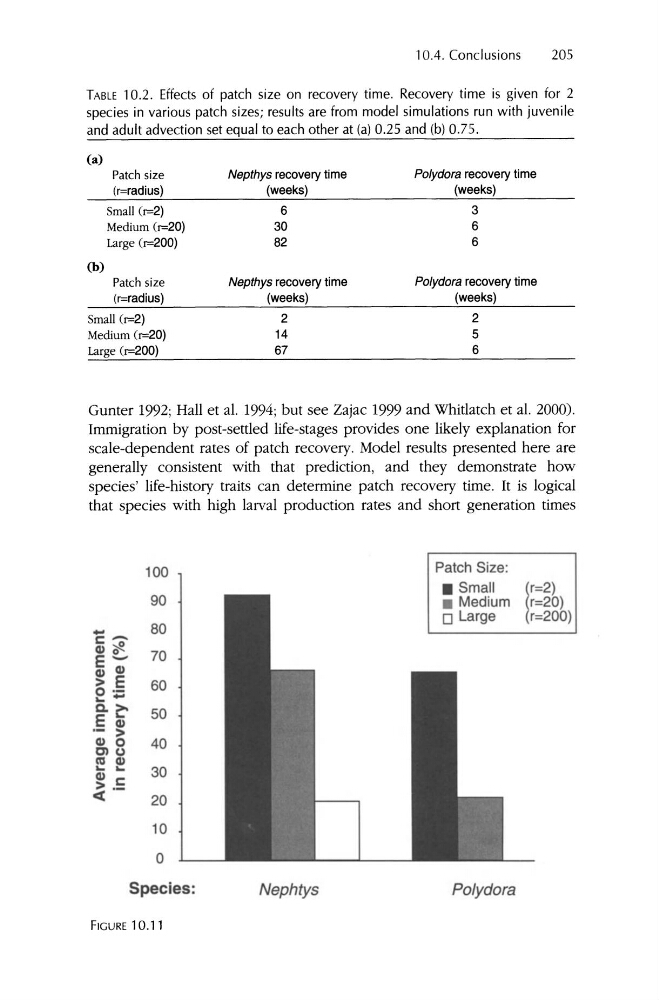
Gunter 1992; Hall et al. 1994; but see Zajac 1999 and Whitlatch et al. 2000).
Immigration by post-settled life-stages provides one likely explanation for
scale-depe ndent rates of patch recovery. Model results presented here are
gene rally consistent with that prediction, and they demonstrate how
species ' life-history traits can determine patch recovery time. It is logical
that species with high larval production rates and short generation times
- c:: -
Q) "ifl
E- 70
Q) Q)
o .> E 60
LoE Q)
.- >
50
Q) 0
40
Clu
m Q)
Lo
Q)
Lo
c::
30
10
0
Species:
90
80
100
Patch Size:
• Small
r=2)
• Medium r=20)
o Large
r=200)
Polydora
Nephtys
FIG U RE 10 .11
205
TABLE 10.2. Effects of patch size on recovery time. Recovery ti me is given for 2
species in various patch sizes; results are from model simulatio ns run w ith juvenile
and adult advecti on set equal to each other at (a) 0.25 and (b) 0.75.
(a)
Patch size
(r=radius)
Nepthys recovery time
(weeks)
Polydora recovery time
(weeks)
Small (r=2)
Medium (r=20)
Large (r=200)
6
30
82
3
6
6
(b)
Patch size
(r=radius)
Nepthys recovery time
(weeks)
Polydora recovery time
(weeks)
Small (r=2)
Mediu m (r=20)
Large (r=200)
2
14
67
2
5
6
Gunter 1992; Hall et al. 1994; but see Zajac 1999 and Whitlatch et al. 2000).
Immigration by post-settled life-stages provides one likely explanation for
scale-depe ndent rates of patch recovery. Model results presented here are
gene rally consistent with that prediction, and they demonstrate how
species ' life-history traits can determine patch recovery time. It is logical
that species with high larval production rates and short generation times
- c:: -
Q) "ifl
E- 70
Q) Q)
o .> E 60
LoE Q)
.- >
50
Q) 0
40
Clu
m Q)
Lo
Q)
Lo
c::
30
10
0
Species:
90
80
100
Patch Size:
• Small
r=2)
• Medium r=20)
o Large
r=200)
Polydora
Nephtys
FIG U RE 10 .11