

9.1. Introduction
165
Gr"at Bay Nat;"",,1 E. tua,in"
R". " 'ch R". ",v"
Squ ml COU R.
\rronnicut R.
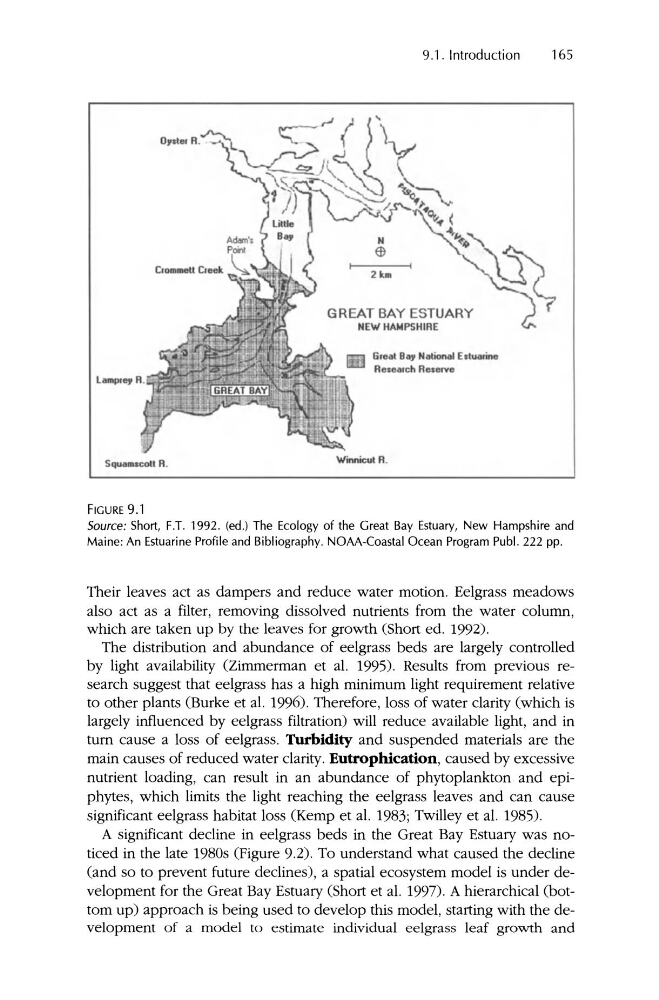
FIGURE 9.1
Source: Short, F.T. 1992 . (ed.) The Ecology of the Great Bay Estuary, New Hampshire and
Maine: An Estuarine Profile and Bibliography. NOAA-Coastal Ocean Program Pub!. 222 pp.
Their leaves act as dampers and reduce water motion . Eelgrass meadows
also act as a filter, removing dissolved nutrients from the water column,
which are taken up by the leaves for growth (Short ed . 1992).
The distribution and abundance of eelgrass beds are largely controlled
by light availability (Zimmerman et al. 1995). Results from previous research suggest that eelgrass has a high minimum light requirement relative
to other plants (Burke et al. 1996). Therefore, loss of water clarity (which is
largely influenced by eelgrass filtration) will reduce available light, and in
turn cause a loss of eelgrass. Turbidity and suspended materials are the
main causes of reduced water clarity. Eutrophication, caused by excessive
nutrient loading, can result in an abundance of phytoplankton and epiphytes, which limits the light reaching the eelgrass leaves and can cause
significant eelgrass habitat loss (Kemp et al. 1983; Twilley et al. 1985),
A significant decline in eelgrass beds in the Great Bay Estuary was noticed in the late 1980s (Figure 9.2). To understand what caused the decline
(and so to prevent future declines), a spatial ecosystem model is under development for the Great Bay Estuary (Short et al. 1997). A hierarchical (bottom up) approach is being used to develop this model , starting with the development of a model to estimate individual eelgrass leaf growth and
165
Gr"at Bay Nat;"",,1 E. tua,in"
R". " 'ch R". ",v"
Squ ml COU R.
\rronnicut R.
FIGURE 9.1
Source: Short, F.T. 1992 . (ed.) The Ecology of the Great Bay Estuary, New Hampshire and
Maine: An Estuarine Profile and Bibliography. NOAA-Coastal Ocean Program Pub!. 222 pp.
Their leaves act as dampers and reduce water motion . Eelgrass meadows
also act as a filter, removing dissolved nutrients from the water column,
which are taken up by the leaves for growth (Short ed . 1992).
The distribution and abundance of eelgrass beds are largely controlled
by light availability (Zimmerman et al. 1995). Results from previous research suggest that eelgrass has a high minimum light requirement relative
to other plants (Burke et al. 1996). Therefore, loss of water clarity (which is
largely influenced by eelgrass filtration) will reduce available light, and in
turn cause a loss of eelgrass. Turbidity and suspended materials are the
main causes of reduced water clarity. Eutrophication, caused by excessive
nutrient loading, can result in an abundance of phytoplankton and epiphytes, which limits the light reaching the eelgrass leaves and can cause
significant eelgrass habitat loss (Kemp et al. 1983; Twilley et al. 1985),
A significant decline in eelgrass beds in the Great Bay Estuary was noticed in the late 1980s (Figure 9.2). To understand what caused the decline
(and so to prevent future declines), a spatial ecosystem model is under development for the Great Bay Estuary (Short et al. 1997). A hierarchical (bottom up) approach is being used to develop this model , starting with the development of a model to estimate individual eelgrass leaf growth and