

8.3. Model Results
155
growth rate for diatoms, however, prevents the light limited decline shown
in Figures 8.10 and 8.11. Dinoflagellates increase with each successive season because of a higher initial seed population at the beginning of each
year, while diatoms show the opposite trend . Interestingly, if the light level
is decreased under these conditions (mixing depth increased) , the intensity
of the interannual trend decreases .
8.3.3. Nutrient Dynamics
Let us next examine the impact of nutrients on phytoplankton communities. To do so, we assume there are no mixing dynamics and that growth
and responses to light are equal for diatoms and dinoflagellates . We also
assume that both phytoplankton groups are equally dependent on the
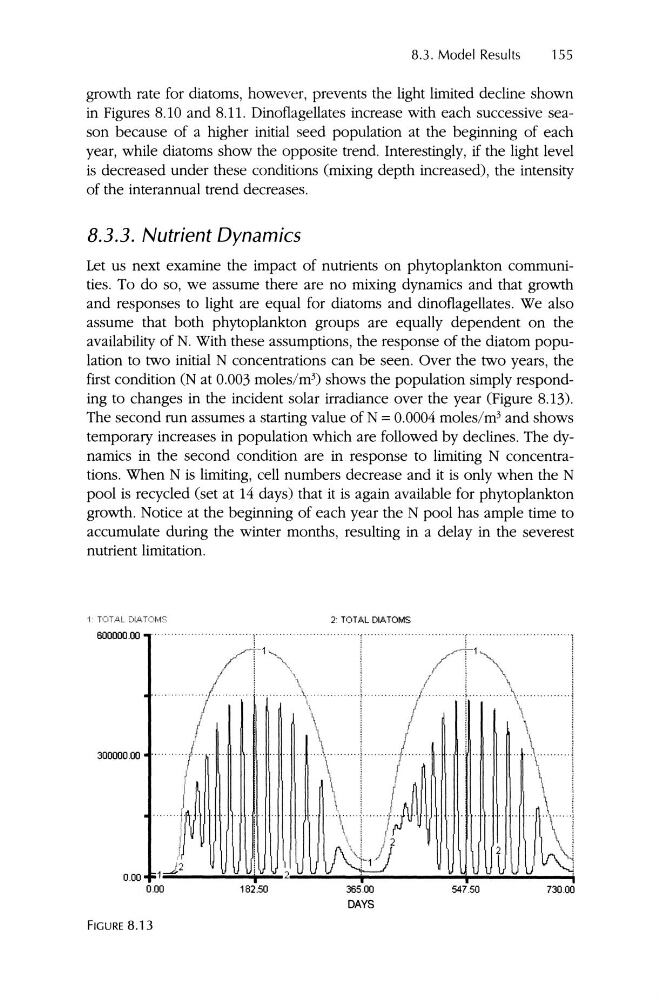
availability of N. With these assumptions, the response of the diatom population to two initial N concentrations can be seen. Over the two years, the
first condition (N at 0.003 moles/rn ') shows the population simply responding to changes in the incident solar irradiance over the year (Figure 8.13).
The second run assumes a starting value of N = 0.0004 moles/rn' and shows
temporary increases in population which are followed by declines. The dynamics in the second condition are in response to limiting N concentrations. When N is limiting, cell numbers decrease and it is only when the N
pool is recycled (set at 14 days) that it is again available for phytoplankton
growth . Notice at the beginning of each year the N pool has ample time to
accumulate during the winter months, resulting in a delay in the severest
nutrient limitation.
-1 : TOTft.L DIA TOM S
600000.00
... .. . .... ... .. .... ... . . . . .• ...
2: TOTAL DIATOMS
300000.00
0.00 1
0.00
l i \
I
!
\ ,
' l
/
i
:
· · fL
1
. .\ II J. . \\ i
\
f
\
\
1
i
i
2
182.50
N:lJ'
I
i
365.00
DAYS
i
547.50
i
730.00
FIGURE 8.13
155
growth rate for diatoms, however, prevents the light limited decline shown
in Figures 8.10 and 8.11. Dinoflagellates increase with each successive season because of a higher initial seed population at the beginning of each
year, while diatoms show the opposite trend . Interestingly, if the light level
is decreased under these conditions (mixing depth increased) , the intensity
of the interannual trend decreases .
8.3.3. Nutrient Dynamics
Let us next examine the impact of nutrients on phytoplankton communities. To do so, we assume there are no mixing dynamics and that growth
and responses to light are equal for diatoms and dinoflagellates . We also
assume that both phytoplankton groups are equally dependent on the
availability of N. With these assumptions, the response of the diatom population to two initial N concentrations can be seen. Over the two years, the
first condition (N at 0.003 moles/rn ') shows the population simply responding to changes in the incident solar irradiance over the year (Figure 8.13).
The second run assumes a starting value of N = 0.0004 moles/rn' and shows
temporary increases in population which are followed by declines. The dynamics in the second condition are in response to limiting N concentrations. When N is limiting, cell numbers decrease and it is only when the N
pool is recycled (set at 14 days) that it is again available for phytoplankton
growth . Notice at the beginning of each year the N pool has ample time to
accumulate during the winter months, resulting in a delay in the severest
nutrient limitation.
-1 : TOTft.L DIA TOM S
600000.00
... .. . .... ... .. .... ... . . . . .• ...
2: TOTAL DIATOMS
300000.00
0.00 1
0.00
l i \
I
!
\ ,
' l
/
i
:
· · fL
1
. .\ II J. . \\ i
\
f
\
\
1
i
i
2
182.50
N:lJ'
I
i
365.00
DAYS
i
547.50
i
730.00
FIGURE 8.13