

5.2. Arrays in the Population Cohort Model
93
YEAR 0 1
AGE01
YEAR 1 2
AGE 12
YEAR 23
O -.......
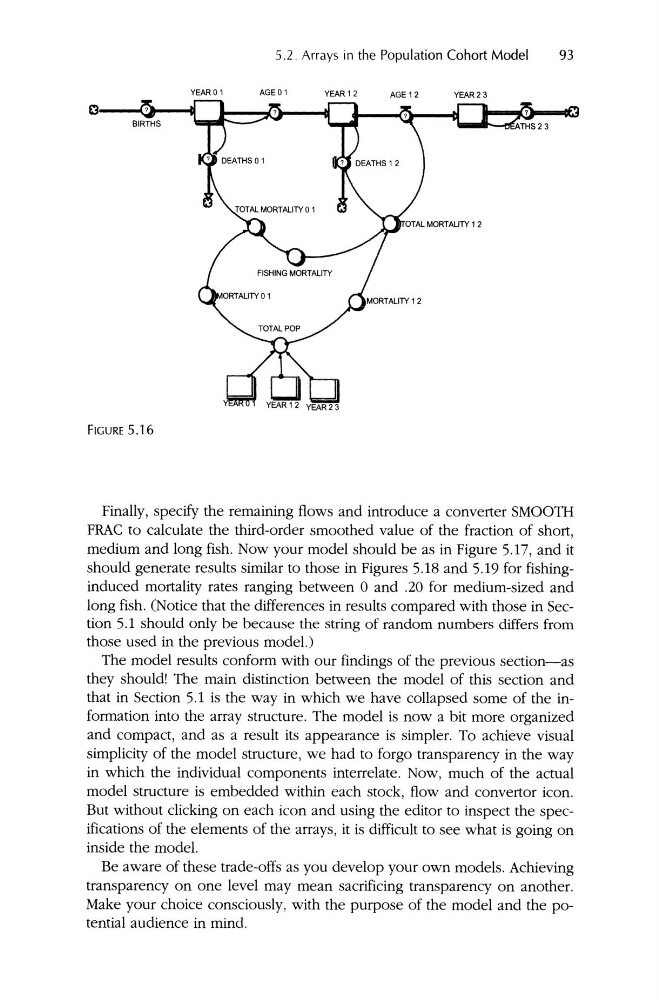
FIGURE 5.16
Finally, specify the remaining flows and introduce a converter SMOOTH
FRAC to calculate the third-order smoothed value of the fraction of short,
medium and long fish. Now your model should be as in Figure 5.17, and it
should generate results similar to those in Figures 5.18 and 5.19 for fishinginduced mortality rates ranging between 0 and .20 for medium-sized and
long fish. (Notice that the differences in results compa red with those in Section 5.1 should only be beca use the string of random numbers differs from
those used in the previous model .)
The model results conform with our findings of the previous section-as
they should! The main distinction between the model of this section and
that in Section 5.1 is the way in which we have collapsed some of the information into the array structure . The model is now a bit more organized
and compact, and as a result its appea rance is simpler. To achieve visual
simplicity of the model structure, we had to forgo transparency in the way
in which the individual compo ne nts interrelate. Now, much of the actual
model structure is embedde d within each stock, flow and convertor icon.
But without clicking on each icon and using the editor to inspect the specifications of the elements of the arrays, it is difficult to see what is going on
inside the model.
Be aware of these trade-offs as you develop your ow n mode ls. Achieving
transpa rency on one level may mean sacrificing transpare ncy on another.
Make your choice consciously, with the purpose of the model and the potential audie nce in mind.
93
YEAR 0 1
AGE01
YEAR 1 2
AGE 12
YEAR 23
O -.......
FIGURE 5.16
Finally, specify the remaining flows and introduce a converter SMOOTH
FRAC to calculate the third-order smoothed value of the fraction of short,
medium and long fish. Now your model should be as in Figure 5.17, and it
should generate results similar to those in Figures 5.18 and 5.19 for fishinginduced mortality rates ranging between 0 and .20 for medium-sized and
long fish. (Notice that the differences in results compa red with those in Section 5.1 should only be beca use the string of random numbers differs from
those used in the previous model .)
The model results conform with our findings of the previous section-as
they should! The main distinction between the model of this section and
that in Section 5.1 is the way in which we have collapsed some of the information into the array structure . The model is now a bit more organized
and compact, and as a result its appea rance is simpler. To achieve visual
simplicity of the model structure, we had to forgo transparency in the way
in which the individual compo ne nts interrelate. Now, much of the actual
model structure is embedde d within each stock, flow and convertor icon.
But without clicking on each icon and using the editor to inspect the specifications of the elements of the arrays, it is difficult to see what is going on
inside the model.
Be aware of these trade-offs as you develop your ow n mode ls. Achieving
transpa rency on one level may mean sacrificing transpare ncy on another.
Make your choice consciously, with the purpose of the model and the potential audie nce in mind.