

86
5. Impact of Fishing Pressure on Mean Length of Fish
1: SMOOTHSHORTS... 2: SMOOTHSHORT S... 3: SMOOTHSHORTS... 4: SMOOTHSHORT S... 5: SMOOTHSHORT S...
1:
0.50
-
5=
5
1
I
2 _3 -
14 -
2
3
3
2
-
2
1- 1--::
1:
0.25
0.00
0.00
1:
40.00
Years
20.00
60.00
80.00
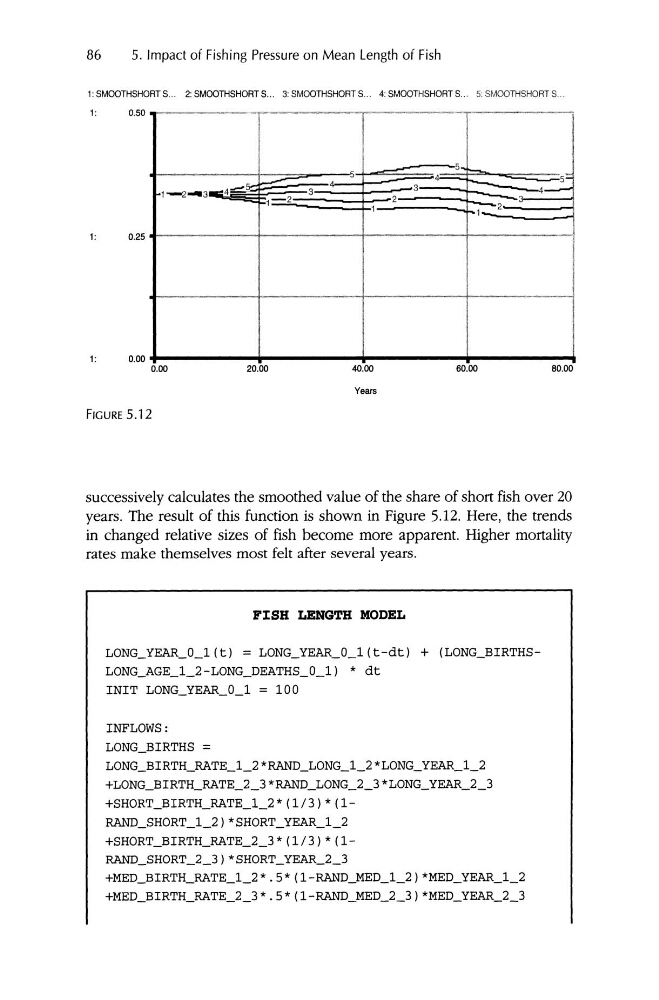
FIGURE 5.12
successively calculates the smoothed value of the share of short fish over 20
years. The result of this function is shown in Figure 5.12. Here, the trends
in changed relative sizes of fish become more apparent. Higher mortality
rates make themselves most felt after several years.
FISH LENGTH MODEL
LONG_YEAR_0_1(t) = LONG_YEAR_0_1(t -dt) + (LONG_BIRTHSLONG_AGE_1_2-LONG_DEATHS_0_1) * dt
INIT LONG_YEAR_0_1 = 100
INFLOWS:
LONG_BIRTHS =
LONG_BIRTH_RATE_1_2 *RAND_LONG_1_2 *LONG_YEAR_1_2
+LONG_BIRTH_RATE_2_3*RAND_LONG_2_3*LONG_YEAR_2_3
+SHORT_BIRTH_RATE_1_2*(1 / 3)*(1 -
RAND_SHORT_1_2) *SHORT_YEAR_1_2
+SHORT_BIRTH_RATE_2_3*(1 /3)*(1 -
RAND_SHORT_2_ 3)*SHORT_YEAR_2_3
+MED_BIRTH_RATE_1_2 * .5*(1-RAND_MED_1_2)*MED_YEAR_1_2
+MED_BIRTH_RATE_2_3* .5* (1-RAND_MED_2_3) *MED_YEAR_ 2_ 3
5. Impact of Fishing Pressure on Mean Length of Fish
1: SMOOTHSHORTS... 2: SMOOTHSHORT S... 3: SMOOTHSHORTS... 4: SMOOTHSHORT S... 5: SMOOTHSHORT S...
1:
0.50
-
5=
5
1
I
2 _3 -
14 -
2
3
3
2
-
2
1- 1--::
1:
0.25
0.00
0.00
1:
40.00
Years
20.00
60.00
80.00
FIGURE 5.12
successively calculates the smoothed value of the share of short fish over 20
years. The result of this function is shown in Figure 5.12. Here, the trends
in changed relative sizes of fish become more apparent. Higher mortality
rates make themselves most felt after several years.
FISH LENGTH MODEL
LONG_YEAR_0_1(t) = LONG_YEAR_0_1(t -dt) + (LONG_BIRTHSLONG_AGE_1_2-LONG_DEATHS_0_1) * dt
INIT LONG_YEAR_0_1 = 100
INFLOWS:
LONG_BIRTHS =
LONG_BIRTH_RATE_1_2 *RAND_LONG_1_2 *LONG_YEAR_1_2
+LONG_BIRTH_RATE_2_3*RAND_LONG_2_3*LONG_YEAR_2_3
+SHORT_BIRTH_RATE_1_2*(1 / 3)*(1 -
RAND_SHORT_1_2) *SHORT_YEAR_1_2
+SHORT_BIRTH_RATE_2_3*(1 /3)*(1 -
RAND_SHORT_2_ 3)*SHORT_YEAR_2_3
+MED_BIRTH_RATE_1_2 * .5*(1-RAND_MED_1_2)*MED_YEAR_1_2
+MED_BIRTH_RATE_2_3* .5* (1-RAND_MED_2_3) *MED_YEAR_ 2_ 3