

34
P. Tett
recovers rapidly – that is, it shows a high level of resilience – because the AZE is
surrounded by plenty of healthy benthos to reseed the impacted area with larvae
and migration within the sediment. So, on a zone A scale, disturbance to benthic
health is of little serious concern so long as confined to one or a few AZEs which
comprise only a small fraction of the seabed of a water body such as a sea-loch. But
what could happen on the zone B scale?
increasing availability of organic matter
adverse effects
good or
high
mod.
poor
bad
WFD
quality
pressure
ecosystem health (vigour + organization)
oligotrophic
optimal
polu
trophic
resistance
A
B
C
biodiversity
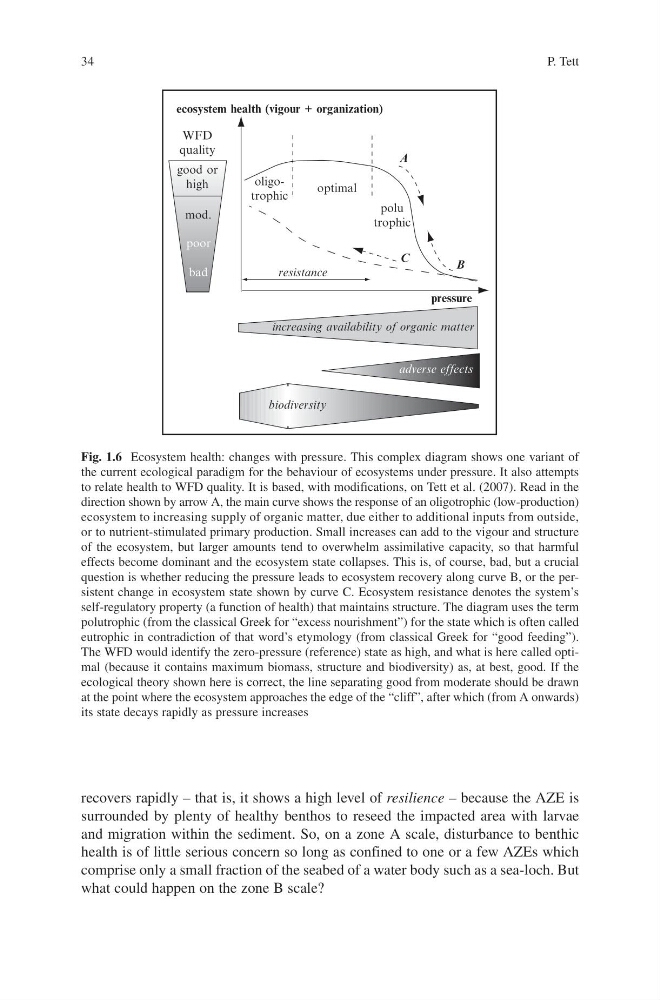
Fig. 1.6 Ecosystem health: changes with pressure. This complex diagram shows one variant of
the current ecological paradigm for the behaviour of ecosystems under pressure. It also attempts
to relate health to WFD quality. It is based, with modifications, on Tett et al. (2007). Read in the
direction shown by arrow A, the main curve shows the response of an oligotrophic (low-production)
ecosystem to increasing supply of organic matter, due either to additional inputs from outside,
or to nutrient-stimulated primary production. Small increases can add to the vigour and structure
of the ecosystem, but larger amounts tend to overwhelm assimilative capacity, so that harmful
effects become dominant and the ecosystem state collapses. This is, of course, bad, but a crucial
question is whether reducing the pressure leads to ecosystem recovery along curve B, or the persistent change in ecosystem state shown by curve C. Ecosystem resistance denotes the system’s
self-regulatory property (a function of health) that maintains structure. The diagram uses the term
polutrophic (from the classical Greek for “excess nourishment”) for the state which is often called
eutrophic in contradiction of that word’s etymology (from classical Greek for “good feeding”).
The WFD would identify the zero-pressure (reference) state as high, and what is here called optimal (because it contains maximum biomass, structure and biodiversity) as, at best, good. If the
ecological theory shown here is correct, the line separating good from moderate should be drawn
at the point where the ecosystem approaches the edge of the “cliff”, after which (from A onwards)
its state decays rapidly as pressure increases
P. Tett
recovers rapidly – that is, it shows a high level of resilience – because the AZE is
surrounded by plenty of healthy benthos to reseed the impacted area with larvae
and migration within the sediment. So, on a zone A scale, disturbance to benthic
health is of little serious concern so long as confined to one or a few AZEs which
comprise only a small fraction of the seabed of a water body such as a sea-loch. But
what could happen on the zone B scale?
increasing availability of organic matter
adverse effects
good or
high
mod.
poor
bad
WFD
quality
pressure
ecosystem health (vigour + organization)
oligotrophic
optimal
polu
trophic
resistance
A
B
C
biodiversity
Fig. 1.6 Ecosystem health: changes with pressure. This complex diagram shows one variant of
the current ecological paradigm for the behaviour of ecosystems under pressure. It also attempts
to relate health to WFD quality. It is based, with modifications, on Tett et al. (2007). Read in the
direction shown by arrow A, the main curve shows the response of an oligotrophic (low-production)
ecosystem to increasing supply of organic matter, due either to additional inputs from outside,
or to nutrient-stimulated primary production. Small increases can add to the vigour and structure
of the ecosystem, but larger amounts tend to overwhelm assimilative capacity, so that harmful
effects become dominant and the ecosystem state collapses. This is, of course, bad, but a crucial
question is whether reducing the pressure leads to ecosystem recovery along curve B, or the persistent change in ecosystem state shown by curve C. Ecosystem resistance denotes the system’s
self-regulatory property (a function of health) that maintains structure. The diagram uses the term
polutrophic (from the classical Greek for “excess nourishment”) for the state which is often called
eutrophic in contradiction of that word’s etymology (from classical Greek for “good feeding”).
The WFD would identify the zero-pressure (reference) state as high, and what is here called optimal (because it contains maximum biomass, structure and biodiversity) as, at best, good. If the
ecological theory shown here is correct, the line separating good from moderate should be drawn
at the point where the ecosystem approaches the edge of the “cliff”, after which (from A onwards)
its state decays rapidly as pressure increases