

282
F. Asche et al.
9.3.2.3 Productivity Development in Norway Relative to Other Producers
Norwegian salmon producers have been the main object of several studies on productivity. Bjørndal (2002) compares cost data for Norwegian and Chilean salmon farms and
concludes that the cost level in Chile is similar or lower than that in Norway, although
the cost composition is different since Chilean processing costs are lower, but transportation costs are higher. Industry sources normally indicate that average production costs in
Scotland are between 0.1 and 0.3 euros/kg higher than in Norway.
While a lack of data prevents us from reporting on the specific productivity
development among salmon producers, it is possible to make assumptions by investigating the development in production shares. In a free market, changes in production
shares exist due to differences in productivity development or production costs. On
the other hand, in markets with trade restrictions and regulations, the development
in production shares will show the combined effect of trade restrictions, regulations, and the relative productivity growth.
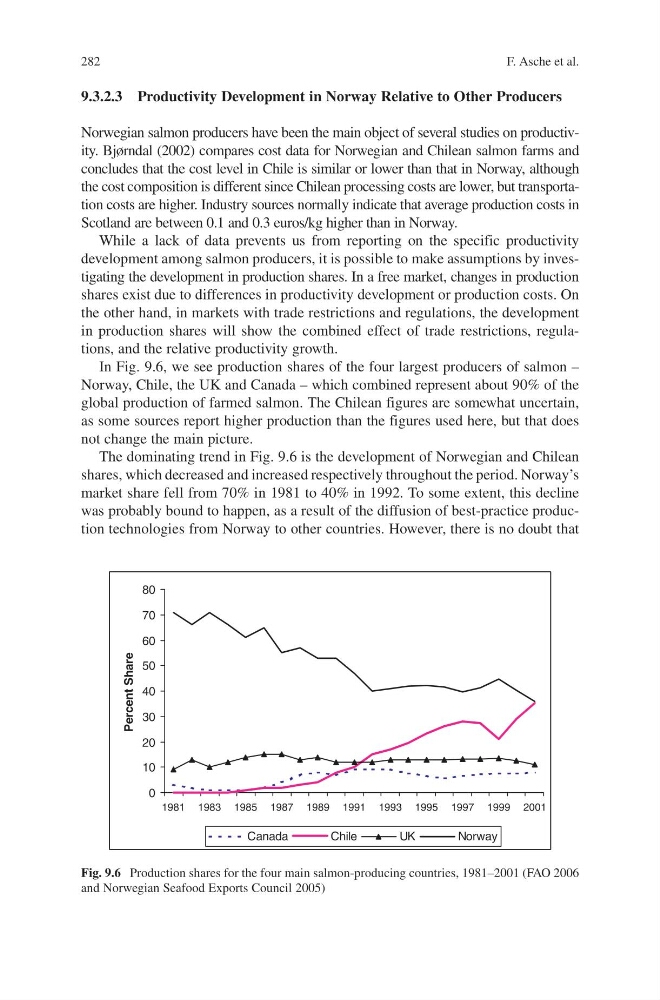
In Fig. 9.6, we see production shares of the four largest producers of salmon –
Norway, Chile, the UK and Canada – which combined represent about 90% of the
global production of farmed salmon. The Chilean figures are somewhat uncertain,
as some sources report higher production than the figures used here, but that does
not change the main picture.
The dominating trend in Fig. 9.6 is the development of Norwegian and Chilean
shares, which decreased and increased respectively throughout the period. Norway’s
market share fell from 70% in 1981 to 40% in 1992. To some extent, this decline
was probably bound to happen, as a result of the diffusion of best-practice production technologies from Norway to other countries. However, there is no doubt that
Fig. 9.6 Production shares for the four main salmon-producing countries, 1981–2001 (FAO 2006
and Norwegian Seafood Exports Council 2005)
0
10
20
30
40
50
60
70
80
1981 1983 1985 1987 1989 1991 1993 1995 1997 1999 2001
Percent Share
Canada
Chile
UK
Norway
F. Asche et al.
9.3.2.3 Productivity Development in Norway Relative to Other Producers
Norwegian salmon producers have been the main object of several studies on productivity. Bjørndal (2002) compares cost data for Norwegian and Chilean salmon farms and
concludes that the cost level in Chile is similar or lower than that in Norway, although
the cost composition is different since Chilean processing costs are lower, but transportation costs are higher. Industry sources normally indicate that average production costs in
Scotland are between 0.1 and 0.3 euros/kg higher than in Norway.
While a lack of data prevents us from reporting on the specific productivity
development among salmon producers, it is possible to make assumptions by investigating the development in production shares. In a free market, changes in production
shares exist due to differences in productivity development or production costs. On
the other hand, in markets with trade restrictions and regulations, the development
in production shares will show the combined effect of trade restrictions, regulations, and the relative productivity growth.
In Fig. 9.6, we see production shares of the four largest producers of salmon –
Norway, Chile, the UK and Canada – which combined represent about 90% of the
global production of farmed salmon. The Chilean figures are somewhat uncertain,
as some sources report higher production than the figures used here, but that does
not change the main picture.
The dominating trend in Fig. 9.6 is the development of Norwegian and Chilean
shares, which decreased and increased respectively throughout the period. Norway’s
market share fell from 70% in 1981 to 40% in 1992. To some extent, this decline
was probably bound to happen, as a result of the diffusion of best-practice production technologies from Norway to other countries. However, there is no doubt that
Fig. 9.6 Production shares for the four main salmon-producing countries, 1981–2001 (FAO 2006
and Norwegian Seafood Exports Council 2005)
0
10
20
30
40
50
60
70
80
1981 1983 1985 1987 1989 1991 1993 1995 1997 1999 2001
Percent Share
Canada
Chile
UK
Norway