

278
F. Asche et al.
This can be explained by the fact that a stable supply of high-quality fish presents
market opportunities that have not existed for the wild supply of similar fish. For
instance, there is not going to be any price pressure if the farmed fish is sold in
periods when there had previously been no supply of similar wild-caught fish, due
to seasonality. Moreover, demand can increase when the logistical systems can
operate with a stable and relatively predictable supply.
Somewhat simplified, one can say that there are two main market structures that
an aquaculture producer or country can face, following an increase in their production. If the market size is limited and there are few other species or products from
which one can win market share, prices will decline rapidly. If, on the other hand,
there is a large market where the producer or country in question only produces an
insignificant share, there may be no or only a weak price effect. There is of course
a continuum between these two structures, and the main reason for shrimp prices
declining at a lower rate than salmon is that the global production of shrimp is substantially larger. If one looks closer at the shrimp producers, one will also observe
that there have been substantial changes in the top 10 list of producing countries
within short time periods (Anderson 2003), illustrating how little effect each of the
large producer countries has on the price. The larger the market, the weaker the
effect of any single country’s production on the price and the more exposed that
production will be to the impacts of changes in other parts of the world.
The production and price of Egyptian tilapia presents another interesting case.
Egypt is the world’s second largest producer of tilapia after China, but imports and
exports very little. Hence, one can say that tilapia producers in Egypt serve a market
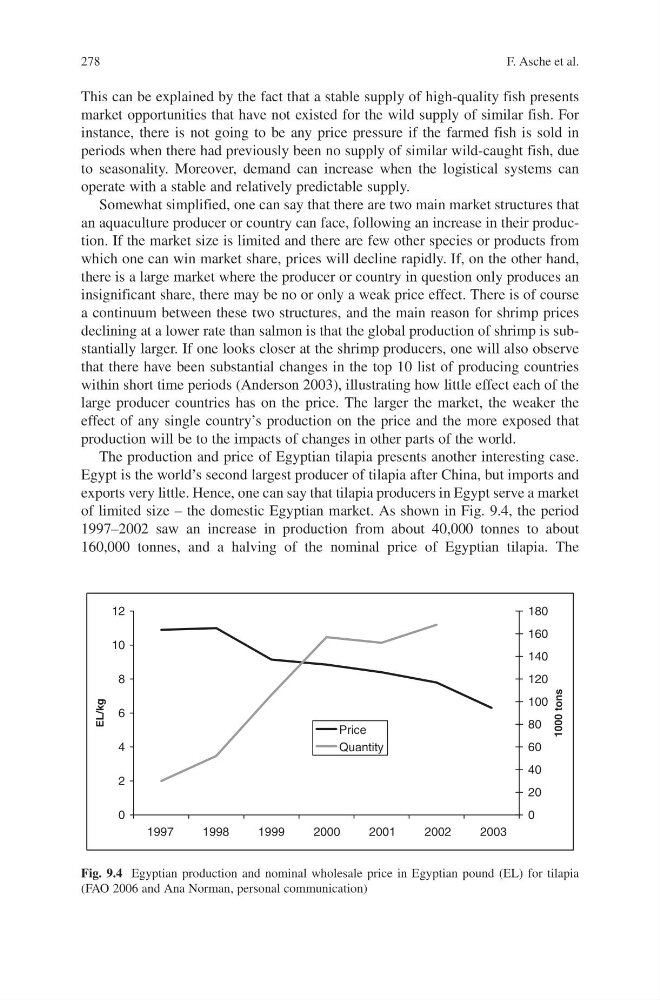
of limited size – the domestic Egyptian market. As shown in Fig. 9.4, the period
1997–2002 saw an increase in production from about 40,000 tonnes to about
160,000 tonnes, and a halving of the nominal price of Egyptian tilapia. The
Fig. 9.4 Egyptian production and nominal wholesale price in Egyptian pound (EL) for tilapia
(FAO 2006 and Ana Norman, personal communication)
0
2
4
6
8
10
12
1997
1998
1999
2000
2001
2002
2003
EL/kg
0
20
40
60
80
100
120
140
160
180
1000 tons
Price
Quantity
F. Asche et al.
This can be explained by the fact that a stable supply of high-quality fish presents
market opportunities that have not existed for the wild supply of similar fish. For
instance, there is not going to be any price pressure if the farmed fish is sold in
periods when there had previously been no supply of similar wild-caught fish, due
to seasonality. Moreover, demand can increase when the logistical systems can
operate with a stable and relatively predictable supply.
Somewhat simplified, one can say that there are two main market structures that
an aquaculture producer or country can face, following an increase in their production. If the market size is limited and there are few other species or products from
which one can win market share, prices will decline rapidly. If, on the other hand,
there is a large market where the producer or country in question only produces an
insignificant share, there may be no or only a weak price effect. There is of course
a continuum between these two structures, and the main reason for shrimp prices
declining at a lower rate than salmon is that the global production of shrimp is substantially larger. If one looks closer at the shrimp producers, one will also observe
that there have been substantial changes in the top 10 list of producing countries
within short time periods (Anderson 2003), illustrating how little effect each of the
large producer countries has on the price. The larger the market, the weaker the
effect of any single country’s production on the price and the more exposed that
production will be to the impacts of changes in other parts of the world.
The production and price of Egyptian tilapia presents another interesting case.
Egypt is the world’s second largest producer of tilapia after China, but imports and
exports very little. Hence, one can say that tilapia producers in Egypt serve a market
of limited size – the domestic Egyptian market. As shown in Fig. 9.4, the period
1997–2002 saw an increase in production from about 40,000 tonnes to about
160,000 tonnes, and a halving of the nominal price of Egyptian tilapia. The
Fig. 9.4 Egyptian production and nominal wholesale price in Egyptian pound (EL) for tilapia
(FAO 2006 and Ana Norman, personal communication)
0
2
4
6
8
10
12
1997
1998
1999
2000
2001
2002
2003
EL/kg
0
20
40
60
80
100
120
140
160
180
1000 tons
Price
Quantity