

6 Safe and Nutritious Aquaculture Produce
195
temperatures and growth were high) and the 100% VO trial in Norway (January–
May when water temperatures and growth were low; Torstensen et al. 2005).
While restoration of flesh DHA and EPA levels could be reasonably easily
achieved, for all species, in around 14–24 weeks, the reduction of 18:2n-6 and
18:3n-3 was less easy (Bell et al. 2004a; Torstensen et al. 2005; Mourente et al.
2005; Montero et al. 2005). In salmon previously fed 100% LO or RO 18:2n-6
levels were still 75% higher compared to fish fed FO, after 24 weeks on the finishing diet. By comparison, the 18:3n-3 remaining in flesh of salmon previously fed
100% LO was 1344% higher after 24 weeks on the FO finishing diet (Bell et al.
2004a; Torstensen et al. 2004a,b). Comparable values for sea bream flesh were
18:2n-6 120% higher, in fish previously fed 60% RO and 18:3n-3 1525% higher
in fish fed 80% LO, compared to fish fed FO throughout (Izquierdo et al. 2005).
By contrast, for salmon in the whole life cycle trials, 18:3n-3 was only 160% or
360% higher, for fish fed the 75% or 100% VO diet, respectively, while 18:2n-6
was 60% higher than the FO fish after 24 weeks on the FO finishing diet
(Torstensen et al. 2005). Thus, residual C 18 PUFA levels were much lower when
using a VO blend with lower 18:2n-6 and 18:3n-3 levels than when single VO high
in C 18 PUFA were used. A recent study with Atlantic salmon introduced the concept of a dilution model that allowed changes in flesh fatty acids to be accurately
predicted when fish were switched from a VO diet to a FO diet. The model
described by Jobling (2003) supports the findings of the RAFOA studies such that
relatively constant levels of DHA and EPA were found after feeding salmonids a
FO finishing diet for 16–24 weeks.
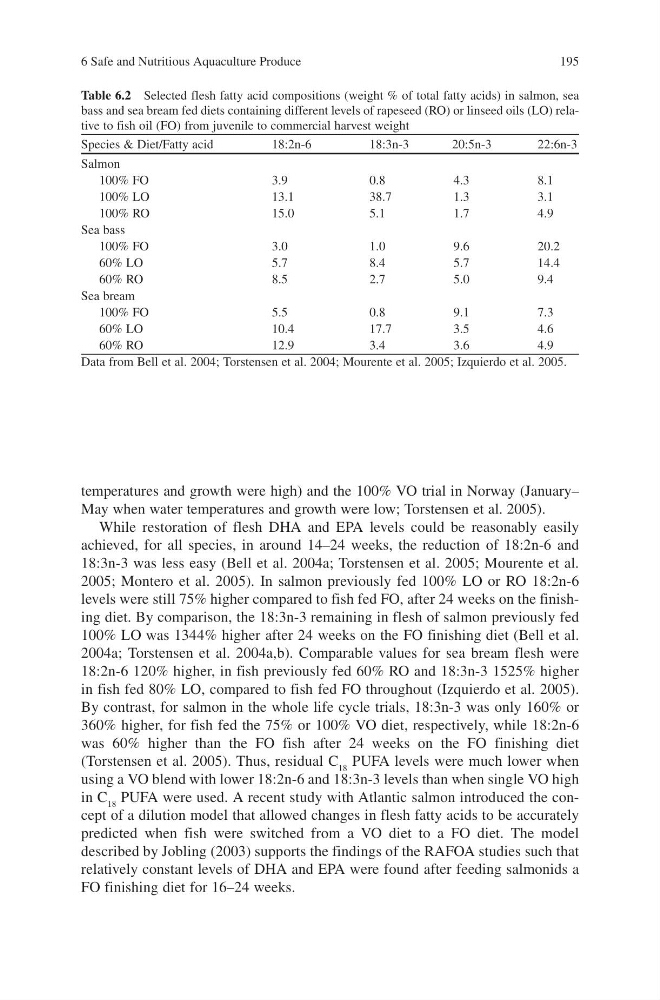
Table 6.2 Selected flesh fatty acid compositions (weight % of total fatty acids) in salmon, sea
bass and sea bream fed diets containing different levels of rapeseed (RO) or linseed oils (LO) relative to fish oil (FO) from juvenile to commercial harvest weight
Species & Diet/Fatty acid
18:2n-6
18:3n-3
20:5n-3
22:6n-3
Salmon
100% FO
3.9
0.8
4.3
8.1
100% LO
13.1
38.7
1.3
3.1
100% RO
15.0
5.1
1.7
4.9
Sea bass
100% FO
3.0
1.0
9.6
20.2
60% LO
5.7
8.4
5.7
14.4
60% RO
8.5
2.7
5.0
9.4
Sea bream
100% FO
5.5
0.8
9.1
7.3
60% LO
10.4
17.7
3.5
4.6
60% RO
12.9
3.4
3.6
4.9
Data from Bell et al. 2004; Torstensen et al. 2004; Mourente et al. 2005; Izquierdo et al. 2005.
195
temperatures and growth were high) and the 100% VO trial in Norway (January–
May when water temperatures and growth were low; Torstensen et al. 2005).
While restoration of flesh DHA and EPA levels could be reasonably easily
achieved, for all species, in around 14–24 weeks, the reduction of 18:2n-6 and
18:3n-3 was less easy (Bell et al. 2004a; Torstensen et al. 2005; Mourente et al.
2005; Montero et al. 2005). In salmon previously fed 100% LO or RO 18:2n-6
levels were still 75% higher compared to fish fed FO, after 24 weeks on the finishing diet. By comparison, the 18:3n-3 remaining in flesh of salmon previously fed
100% LO was 1344% higher after 24 weeks on the FO finishing diet (Bell et al.
2004a; Torstensen et al. 2004a,b). Comparable values for sea bream flesh were
18:2n-6 120% higher, in fish previously fed 60% RO and 18:3n-3 1525% higher
in fish fed 80% LO, compared to fish fed FO throughout (Izquierdo et al. 2005).
By contrast, for salmon in the whole life cycle trials, 18:3n-3 was only 160% or
360% higher, for fish fed the 75% or 100% VO diet, respectively, while 18:2n-6
was 60% higher than the FO fish after 24 weeks on the FO finishing diet
(Torstensen et al. 2005). Thus, residual C 18 PUFA levels were much lower when
using a VO blend with lower 18:2n-6 and 18:3n-3 levels than when single VO high
in C 18 PUFA were used. A recent study with Atlantic salmon introduced the concept of a dilution model that allowed changes in flesh fatty acids to be accurately
predicted when fish were switched from a VO diet to a FO diet. The model
described by Jobling (2003) supports the findings of the RAFOA studies such that
relatively constant levels of DHA and EPA were found after feeding salmonids a
FO finishing diet for 16–24 weeks.
Table 6.2 Selected flesh fatty acid compositions (weight % of total fatty acids) in salmon, sea
bass and sea bream fed diets containing different levels of rapeseed (RO) or linseed oils (LO) relative to fish oil (FO) from juvenile to commercial harvest weight
Species & Diet/Fatty acid
18:2n-6
18:3n-3
20:5n-3
22:6n-3
Salmon
100% FO
3.9
0.8
4.3
8.1
100% LO
13.1
38.7
1.3
3.1
100% RO
15.0
5.1
1.7
4.9
Sea bass
100% FO
3.0
1.0
9.6
20.2
60% LO
5.7
8.4
5.7
14.4
60% RO
8.5
2.7
5.0
9.4
Sea bream
100% FO
5.5
0.8
9.1
7.3
60% LO
10.4
17.7
3.5
4.6
60% RO
12.9
3.4
3.6
4.9
Data from Bell et al. 2004; Torstensen et al. 2004; Mourente et al. 2005; Izquierdo et al. 2005.