

162
E.J. Cook et al.
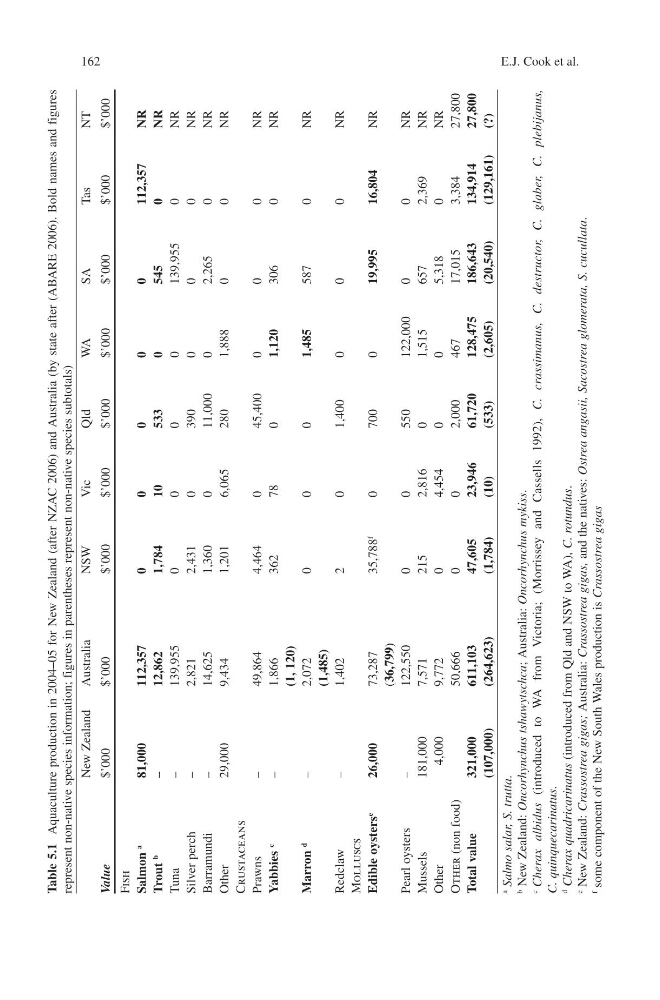
Table 5.1
Aquaculture production in 2004–05 for New Zealand (after NZAC 2006) and Australia (by state after (ABARE 2006). Bold names and figures
represent non-native species information; figures in parentheses represent non-native species subtotals)
New Zealand
Australia
NSW
Vic
Qld
WA
SA
Tas
NT
Value
$’000
$’000
$’000
$’000
$’000
$’000
$’000
$’000
$’000
Fish
Salmon
a
81,000
112,357
0
0
0
0
0
112,357
NR
Trout
b
–
12,862
1,784
10
533
0
545
0
NR
Tuna
–
139,955
0
0
0
0
139,955
0
NR
Silver perch
–
2,821
2,431
0
390
0
0
0
NR
Barramundi
–
14,625
1,360
0
11,000
0
2,265
0
NR
Other
29,000
9,434
1,201
6,065
280
1,888
0
0
NR
Crustaceans
Prawns
–
49,864
4,464
0
45,400
0
0
0
NR
Yabbies
c
–
1,866
362
78
0
1,120
306
0
NR
(1, 120)
Marron
d
–
2,072
0
0
0
1,485
587
0
NR
(1,485)
Redclaw
–
1,402
2
0
1,400
0
0
0
NR
Molluscs
Edible oysters
e
26,000
73,287
35,788
f
0
700
0
19,995
16,804
NR
( 36,799)
Pearl oysters
–
122,550
0
0
550
122,000
0
0
NR
Mussels
181,000
7,571
215
2,816
0
1,515
657
2,369
NR
Other
4,000
9,772
0
4,454
0
0
5,318
0
NR
Other (non food)
50,666
0
0
2,000
467
17,015
3,384
27,800
Total value
321,000
611,103
47,605
23,946
61,720
128,475
186,643
134,914
27,800
(107,000)
(264,623)
(1,784)
(10)
(533)
(2,605)
(20,540)
(129,161)
(?)
a
Salmo salar, S. trutta.
b
New Zealand: Oncorhynchus tshawytschca;
Australia: Oncorhynchus mykiss.
c
Cherax albidus
(introduced to WA from Victoria; (Morrissey and Cassells 1992), C. crassimanus, C. destructor, C. glaber, C. plebijanus,
C. quinquecarinatus.
d
Cherax quadricarinatus
(introduced from Qld and NSW to WA), C. rotundus.
e
New Zealand: Crassostrea gigas;
Australia: Crassostrea gigas,
and the natives: Ostrea angasii, Sacostrea glomerata, S. cucullata.
f
some component of the New South Wales production is Crassostrea gigas
E.J. Cook et al.
Table 5.1
Aquaculture production in 2004–05 for New Zealand (after NZAC 2006) and Australia (by state after (ABARE 2006). Bold names and figures
represent non-native species information; figures in parentheses represent non-native species subtotals)
New Zealand
Australia
NSW
Vic
Qld
WA
SA
Tas
NT
Value
$’000
$’000
$’000
$’000
$’000
$’000
$’000
$’000
$’000
Fish
Salmon
a
81,000
112,357
0
0
0
0
0
112,357
NR
Trout
b
–
12,862
1,784
10
533
0
545
0
NR
Tuna
–
139,955
0
0
0
0
139,955
0
NR
Silver perch
–
2,821
2,431
0
390
0
0
0
NR
Barramundi
–
14,625
1,360
0
11,000
0
2,265
0
NR
Other
29,000
9,434
1,201
6,065
280
1,888
0
0
NR
Crustaceans
Prawns
–
49,864
4,464
0
45,400
0
0
0
NR
Yabbies
c
–
1,866
362
78
0
1,120
306
0
NR
(1, 120)
Marron
d
–
2,072
0
0
0
1,485
587
0
NR
(1,485)
Redclaw
–
1,402
2
0
1,400
0
0
0
NR
Molluscs
Edible oysters
e
26,000
73,287
35,788
f
0
700
0
19,995
16,804
NR
( 36,799)
Pearl oysters
–
122,550
0
0
550
122,000
0
0
NR
Mussels
181,000
7,571
215
2,816
0
1,515
657
2,369
NR
Other
4,000
9,772
0
4,454
0
0
5,318
0
NR
Other (non food)
50,666
0
0
2,000
467
17,015
3,384
27,800
Total value
321,000
611,103
47,605
23,946
61,720
128,475
186,643
134,914
27,800
(107,000)
(264,623)
(1,784)
(10)
(533)
(2,605)
(20,540)
(129,161)
(?)
a
Salmo salar, S. trutta.
b
New Zealand: Oncorhynchus tshawytschca;
Australia: Oncorhynchus mykiss.
c
Cherax albidus
(introduced to WA from Victoria; (Morrissey and Cassells 1992), C. crassimanus, C. destructor, C. glaber, C. plebijanus,
C. quinquecarinatus.
d
Cherax quadricarinatus
(introduced from Qld and NSW to WA), C. rotundus.
e
New Zealand: Crassostrea gigas;
Australia: Crassostrea gigas,
and the natives: Ostrea angasii, Sacostrea glomerata, S. cucullata.
f
some component of the New South Wales production is Crassostrea gigas