

133
5 Timing and Location of Aggregation and Spawning in Reef Fishes
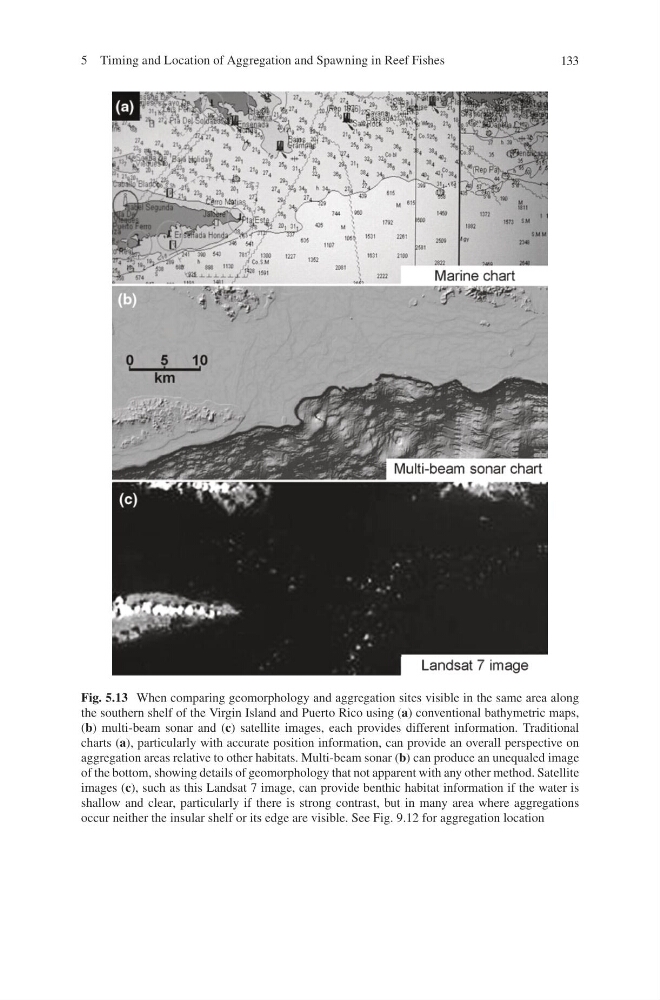
Fig. 5.13 When comparing geomorphology and aggregation sites visible in the same area along
the southern shelf of the Virgin Island and Puerto Rico using ( a ) conventional bathymetric maps,
( b ) multi-beam sonar and ( c ) satellite images, each provides different information. Traditional
charts ( a ), particularly with accurate position information, can provide an overall perspective on
aggregation areas relative to other habitats. Multi-beam sonar ( b ) can produce an unequaled image
of the bottom, showing details of geomorphology that not apparent with any other method. Satellite
images ( c ), such as this Landsat 7 image, can provide benthic habitat information if the water is
shallow and clear, particularly if there is strong contrast, but in many area where aggregations
occur neither the insular shelf or its edge are visible. See Fig. 9.12 for aggregation location
5 Timing and Location of Aggregation and Spawning in Reef Fishes
Fig. 5.13 When comparing geomorphology and aggregation sites visible in the same area along
the southern shelf of the Virgin Island and Puerto Rico using ( a ) conventional bathymetric maps,
( b ) multi-beam sonar and ( c ) satellite images, each provides different information. Traditional
charts ( a ), particularly with accurate position information, can provide an overall perspective on
aggregation areas relative to other habitats. Multi-beam sonar ( b ) can produce an unequaled image
of the bottom, showing details of geomorphology that not apparent with any other method. Satellite
images ( c ), such as this Landsat 7 image, can provide benthic habitat information if the water is
shallow and clear, particularly if there is strong contrast, but in many area where aggregations
occur neither the insular shelf or its edge are visible. See Fig. 9.12 for aggregation location