

328
S� lessoniana are trained to feed on dead meat. Squid are fed on sliced fish meat
to satiation twice daily at 0800 and 1600 h. There has been no sign of specific
preferences for the species of fish consumed. The sizes of the fish chips correspond to the size of the squid, and are one to two times the ML. Squid seize
their food in the water column and eat it while hovering. When squid feed on
live prey, the prey is seized with the tentacles and retained using the arms. When
the squid are fed dead feed, they change their feeding behaviour; they use only
their arms to seize the food and do not perform a positioning step. This change
indicates the success of the training period and that the squid are now accustomed to the dead feed and culture conditions (human appearance with feed and
the environment of the culture tank). One reason for the change in behaviour
is the lower motion of the dead feed compared to active live feed. This kind
of behavioural change is similar to that observed for cultured cuttlefish, Sepia
pharaonis and Sepiella inermis (see Chaps. 12 and 13). Aggressive behaviour
and cannibalism become prominent at this age whenever food is in short supply
and/or there are squid with a wide range of sizes in the same tank. Larger starved
squid that have not learnt to consume dead feed may attack and feed on smaller
squid in the same tank. Human trainers must ensure sufficient feeding and that
every squid is fed.
Growth
Growth is very rapid although the rate of increase in size and weight decreases as
maturity approaches. In open seawater systems, the mantle growth rate decreases to
less than 3 % daily after 40 days of age and the rate of weight gain decreases to less
than 5 % after 50 days of age. For S� lessoniana reared at 28 °C, the overall average
daily growth rate from hatching to 130 days of age is 2.8 % for length and 6 % for
weight (Nabhitabhata 1996). As in the first 30 days after hatching, the relationship
between ML and W (Fig. 17.4) is exponential in the second phase (30–60 days after
hatching) and the third phase (60–176 days after hatching; Nabhitabhata 2002).
The ‘b’ values from aquaculture batches, 2.738 and 2.502, are higher than those
from wild stocks, 2.218–2.477 (Rattana-anant 1978, 1979, 1980; Roogratri 1997;
Sivashanthini et al. 2009), revealing higher growth rates under culture conditions
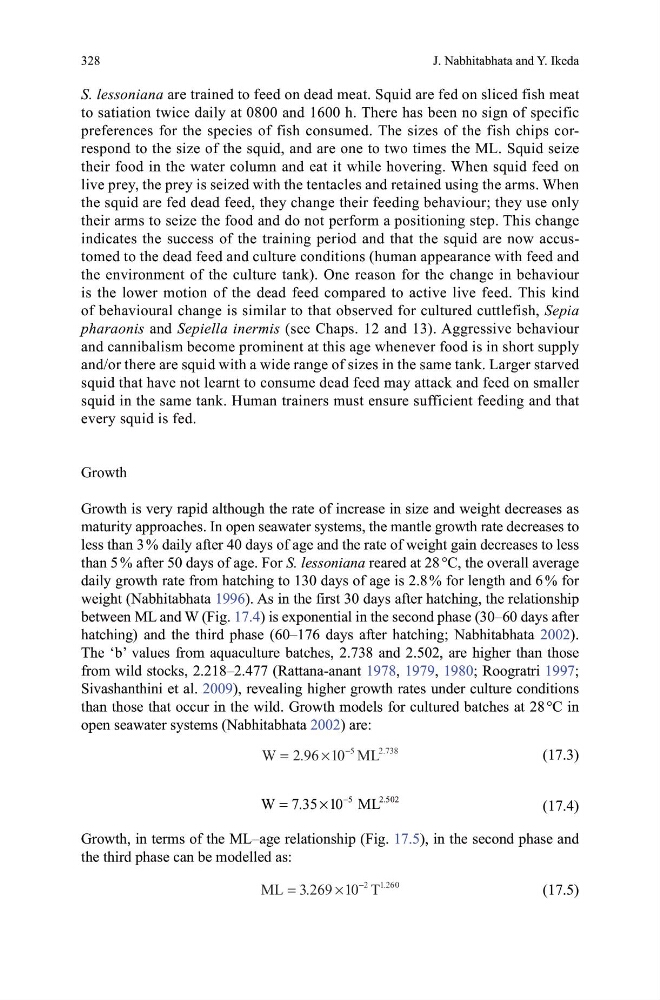
than those that occur in the wild. Growth models for cultured batches at 28 °C in
open seawater systems (Nabhitabhata 2002) are:
(17.3)
(17.4)
Growth, in terms of the ML–age relationship (Fig. 17.5), in the second phase and
the third phase can be modelled as:
(17.5)
W 296 1 ML
5
2738
=
×
−
.
.
0
5
2.502
W 7.35 10 ML
−
=
×
ML 3 269 1 T
2 126
=
×
−
.
.
0
0
J. Nabhitabhata and Y. Ikeda
S� lessoniana are trained to feed on dead meat. Squid are fed on sliced fish meat
to satiation twice daily at 0800 and 1600 h. There has been no sign of specific
preferences for the species of fish consumed. The sizes of the fish chips correspond to the size of the squid, and are one to two times the ML. Squid seize
their food in the water column and eat it while hovering. When squid feed on
live prey, the prey is seized with the tentacles and retained using the arms. When
the squid are fed dead feed, they change their feeding behaviour; they use only
their arms to seize the food and do not perform a positioning step. This change
indicates the success of the training period and that the squid are now accustomed to the dead feed and culture conditions (human appearance with feed and
the environment of the culture tank). One reason for the change in behaviour
is the lower motion of the dead feed compared to active live feed. This kind
of behavioural change is similar to that observed for cultured cuttlefish, Sepia
pharaonis and Sepiella inermis (see Chaps. 12 and 13). Aggressive behaviour
and cannibalism become prominent at this age whenever food is in short supply
and/or there are squid with a wide range of sizes in the same tank. Larger starved
squid that have not learnt to consume dead feed may attack and feed on smaller
squid in the same tank. Human trainers must ensure sufficient feeding and that
every squid is fed.
Growth
Growth is very rapid although the rate of increase in size and weight decreases as
maturity approaches. In open seawater systems, the mantle growth rate decreases to
less than 3 % daily after 40 days of age and the rate of weight gain decreases to less
than 5 % after 50 days of age. For S� lessoniana reared at 28 °C, the overall average
daily growth rate from hatching to 130 days of age is 2.8 % for length and 6 % for
weight (Nabhitabhata 1996). As in the first 30 days after hatching, the relationship
between ML and W (Fig. 17.4) is exponential in the second phase (30–60 days after
hatching) and the third phase (60–176 days after hatching; Nabhitabhata 2002).
The ‘b’ values from aquaculture batches, 2.738 and 2.502, are higher than those
from wild stocks, 2.218–2.477 (Rattana-anant 1978, 1979, 1980; Roogratri 1997;
Sivashanthini et al. 2009), revealing higher growth rates under culture conditions
than those that occur in the wild. Growth models for cultured batches at 28 °C in
open seawater systems (Nabhitabhata 2002) are:
(17.3)
(17.4)
Growth, in terms of the ML–age relationship (Fig. 17.5), in the second phase and
the third phase can be modelled as:
(17.5)
W 296 1 ML
5
2738
=
×
−
.
.
0
5
2.502
W 7.35 10 ML
−
=
×
ML 3 269 1 T
2 126
=
×
−
.
.
0
0
J. Nabhitabhata and Y. Ikeda