

263
Growth models demonstrate two phases of growth. The early phase was from
hatching to 30 days where the relationships between the ML (mm) and weight (g)
can be expressed as a power regression model (Fig. 15.9; Nabhitabhata et al. 2005):
(15.1)
The relationships between ML and age (d: days after hatching, Fig. 15.10;
Nabhitabhata et al. 2005) and between weight (g) and age (d, Fig. 15.11; Nabhitabhata
et al. 2005) can be expressed as the exponential models:
(15.2)
(15.3)
15.6 Ongrowing
15.6.1 System Requirements and Management
For E� hyllebergi, ongrowing phase starts after the benthic young are able to
accept dead fish meat. Tanks for ongrowing are the same tank used for the nursing
phase and with similar management for both species. The density of E� hyllebergi
4
4.124
W 1.230 10 ML .
−
=
×
ML
e
A
=
×
−
1 988
4 205 10 2
.
.
* ( )
W 2.750 10 e
.
3 0.153A
=
×
−
15 Euprymna hyllebergi and Euprymna tasmanica
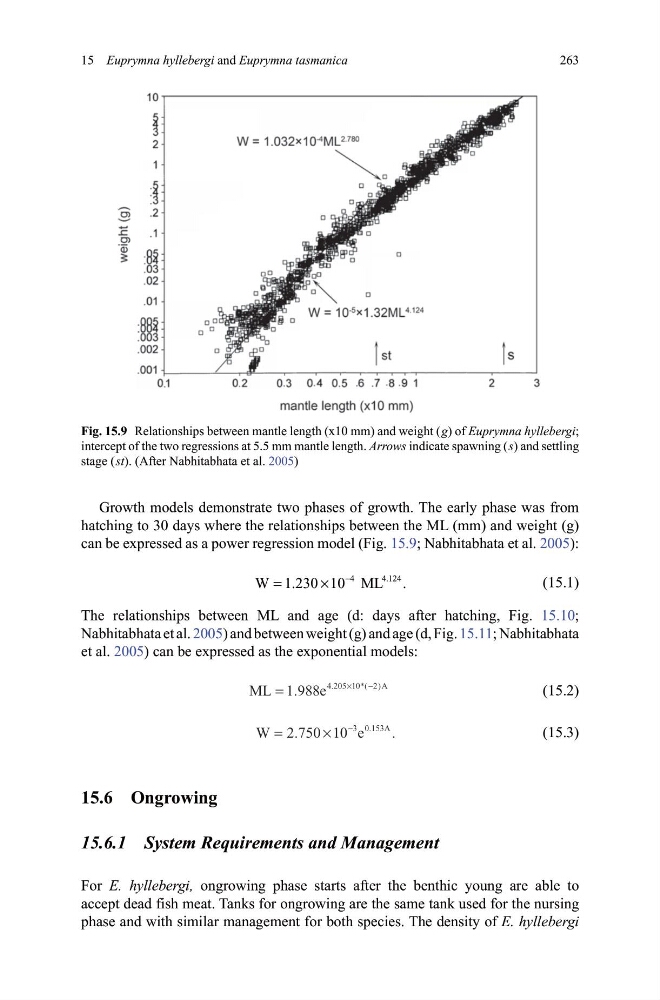
Fig. 15.9 Relationships between mantle length (x10 mm) and weight ( g) of Euprymna hyllebergi;
intercept of the two regressions at 5.5 mm mantle length. Arrows indicate spawning ( s) and settling
stage ( st). (After Nabhitabhata et al. 2005)
Growth models demonstrate two phases of growth. The early phase was from
hatching to 30 days where the relationships between the ML (mm) and weight (g)
can be expressed as a power regression model (Fig. 15.9; Nabhitabhata et al. 2005):
(15.1)
The relationships between ML and age (d: days after hatching, Fig. 15.10;
Nabhitabhata et al. 2005) and between weight (g) and age (d, Fig. 15.11; Nabhitabhata
et al. 2005) can be expressed as the exponential models:
(15.2)
(15.3)
15.6 Ongrowing
15.6.1 System Requirements and Management
For E� hyllebergi, ongrowing phase starts after the benthic young are able to
accept dead fish meat. Tanks for ongrowing are the same tank used for the nursing
phase and with similar management for both species. The density of E� hyllebergi
4
4.124
W 1.230 10 ML .
−
=
×
ML
e
A
=
×
−
1 988
4 205 10 2
.
.
* ( )
W 2.750 10 e
.
3 0.153A
=
×
−
15 Euprymna hyllebergi and Euprymna tasmanica
Fig. 15.9 Relationships between mantle length (x10 mm) and weight ( g) of Euprymna hyllebergi;
intercept of the two regressions at 5.5 mm mantle length. Arrows indicate spawning ( s) and settling
stage ( st). (After Nabhitabhata et al. 2005)