

Mass balances, anaerobic plants
9.1. Mass balances, anaerobic plants
A schematic representation for an anaerobic plant is shown in Fig 9.1.
~;------.r-~~v~~:Jb)-t--~----~· ~:
•
53
Fig 9.1
Schematic representation, anaerobic wastewater treatment.
A mass balance for an anaerobic treatment plant can be written when we know the
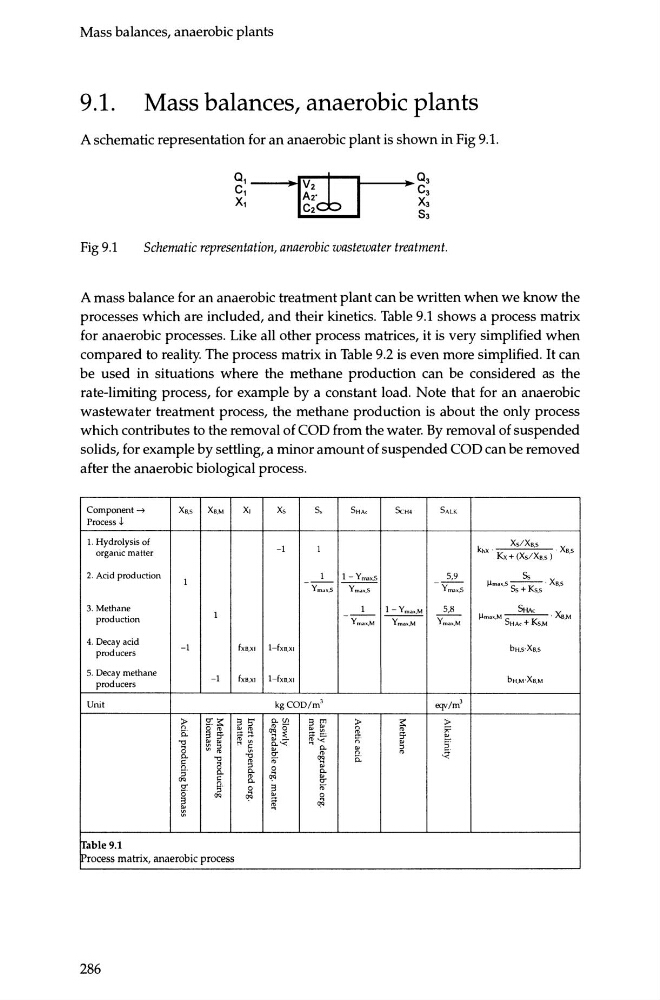
processes which are included, and their kinetics. Table 9.1 shows a process matrix
for anaerobic processes. Like all other process matrices, it is very simplified when
compared to reality. The process matrix in Table 9.2 is even more simplified. It can
be used in situations where the methane production can be considered as the
rate-limiting process, for example by a constant load. Note that for an anaerobic
wastewater treatment process, the methane production is about the only process
which contributes to the removal of COD from the water. By removal of suspended
solids, for example by settling, a minor amount of suspended COD can be removed
after the anaerobic biological process.
Component->
Xs.s
Xo,M
x,
Xs
S,
5HAc
5cH4
SALK
Process .L
I. Hydrolysis of
-1
1
khx ·
Xs/Xo.s
· Xs.s
organic matter
Kx+ (Xs/Xo.s)
2. Acid production
1
1-Y=..s
5,9
Ss
1
-Yma>:,S
Ymali,S
-Ymax,S
Jlmax.S Ss + Ks.s · Xo,s
3. Methane
1
1-Ym•><.M
5,8
sproduction
1
-Y~....,
YmaK;M
Ymax,M
J.lmax,M SHAc + Ks,M . Xu,M
4. Decay acid
-1
fxe.xJ 1-fXB)CI
bH,s·Xs.s
producers
5. Decay methane
-1
fxB,XI
1-fxB,XI
bH,M·Xe,M
producers
Unit
kgCOD/m 3
eqv/m'
)>
g:~
3 !;'
£-S 3 "'
)>
~
)>
R 0 "' . . "'
. . ~ ~·
,.,
3 :;. :; ~
~ ~
;:;:t:,;
:;.
. .
a .... "'~ . . - ~'<
. .
[
!'1 ~
0.'<
!fl ffi
. .
0.
. .
~
0.
.; cr'
"'
c.
~
J·
"" ~
:0
~
0.
a
~
. .
0.
0.
0.
§. "'
~
0.
g:
0
3
s
OQ
ci
~
m
~
lfable 9.1
!Process matrix, anaerobic process
286
9.1. Mass balances, anaerobic plants
A schematic representation for an anaerobic plant is shown in Fig 9.1.
~;------.r-~~v~~:Jb)-t--~----~· ~:
•
53
Fig 9.1
Schematic representation, anaerobic wastewater treatment.
A mass balance for an anaerobic treatment plant can be written when we know the
processes which are included, and their kinetics. Table 9.1 shows a process matrix
for anaerobic processes. Like all other process matrices, it is very simplified when
compared to reality. The process matrix in Table 9.2 is even more simplified. It can
be used in situations where the methane production can be considered as the
rate-limiting process, for example by a constant load. Note that for an anaerobic
wastewater treatment process, the methane production is about the only process
which contributes to the removal of COD from the water. By removal of suspended
solids, for example by settling, a minor amount of suspended COD can be removed
after the anaerobic biological process.
Component->
Xs.s
Xo,M
x,
Xs
S,
5HAc
5cH4
SALK
Process .L
I. Hydrolysis of
-1
1
khx ·
Xs/Xo.s
· Xs.s
organic matter
Kx+ (Xs/Xo.s)
2. Acid production
1
1-Y=..s
5,9
Ss
1
-Yma>:,S
Ymali,S
-Ymax,S
Jlmax.S Ss + Ks.s · Xo,s
3. Methane
1
1-Ym•><.M
5,8
sproduction
1
-Y~....,
YmaK;M
Ymax,M
J.lmax,M SHAc + Ks,M . Xu,M
4. Decay acid
-1
fxe.xJ 1-fXB)CI
bH,s·Xs.s
producers
5. Decay methane
-1
fxB,XI
1-fxB,XI
bH,M·Xe,M
producers
Unit
kgCOD/m 3
eqv/m'
)>
g:~
3 !;'
£-S 3 "'
)>
~
)>
R 0 "' . . "'
. . ~ ~·
,.,
3 :;. :; ~
~ ~
;:;:t:,;
:;.
. .
a .... "'~ . . - ~'<
. .
[
!'1 ~
0.'<
!fl ffi
. .
0.
. .
~
0.
.; cr'
"'
c.
~
J·
"" ~
:0
~
0.
a
~
. .
0.
0.
0.
§. "'
~
0.
g:
0
3
s
OQ
ci
~
m
~
lfable 9.1
!Process matrix, anaerobic process
286