

Design of denitrifying plants
mg Nil
16
14
12
10
8
6
4
2
0
NH 4 - N online measurement
N0 2 • 3 - N online measurement
NH 4 - N grab sample
N02+J - N grab sample &'~
NH 4 - N simulation
N02+3 - N simulation
.·
I
I
\
(I
f I
I I
I I ~I I 8'' \
I
I
( I
• I J I'
I
I
r I ·t
I I
\ ,
0 1 1•
lao
-~
Lj 0
0~~~~~~~~~4r,-~T-r-~r,~~-r-r,_,-~
00.00
04.00
08.00
12.00
16.00
20.00
24.00
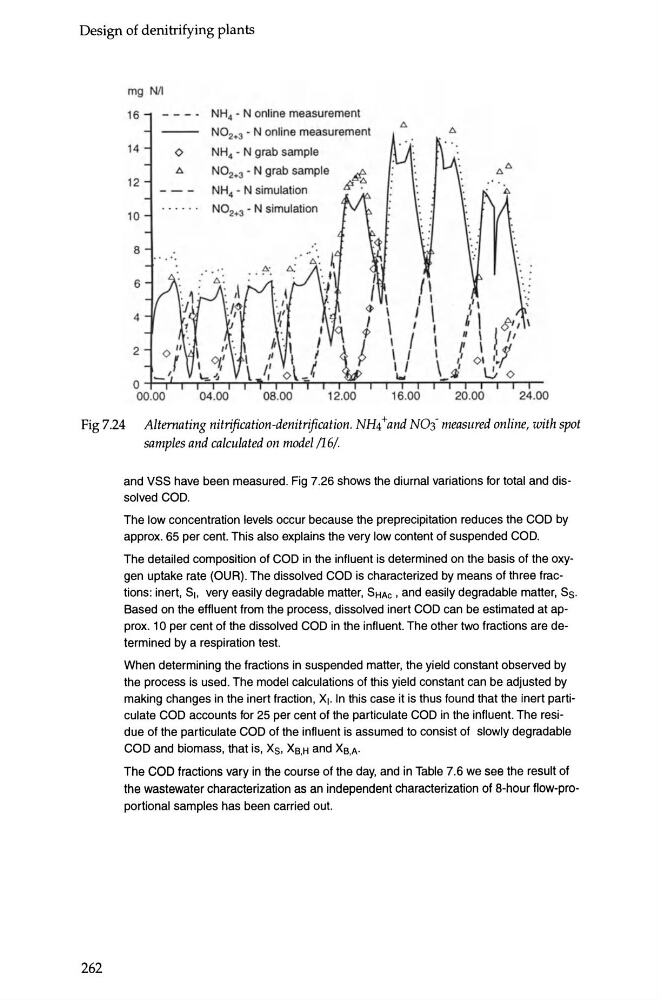
Fig 7.24 Alternating nitrification-denitrification. NH4 + and N03- measured o nline, with spot
samples and calculated on model /16/.
262
and VSS have been measured. Fig 7.26 shows the diurnal variations for total and dissolved COD.
The low concentration levels occur because the preprecipitation reduces the COD by
approx. 65 per cent. This also explains the very low content of suspended COD.
The detailed composition of COD in the influent is determined on the basis of the oxygen uptake rate (OUR). The dissolved COD is characterized by means of three fractions: inert, s,, very easily degradable matter, SHAc , and easily degradable matter, S5.
Based on the effluent from the process, dissolved inert COD can be estimated at approx. 10 per cent of the dissolved COD in the influent. The other two fractions are determined by a respiration test.
When determining the fractions in suspended matter, the yield constant observed by
the process is used. The model calculations of this yield constant can be adjusted by
making changes in the inert fraction , X1• In this case it is thus found that the inert particulate COD accounts for 25 per cent of the particulate COD in the influent. The residue of the particulate COD of the influent is assumed to consist of slowly degradable
COD and biomass, that is, Xs, Xe.H and XB,A·
The COD fractions vary in the course of the day, and in Table 7.6 we see the result of
the wastewater characterization as an independent characterization of 8-hour flow-proportional samples has been carried out.
mg Nil
16
14
12
10
8
6
4
2
0
NH 4 - N online measurement
N0 2 • 3 - N online measurement
NH 4 - N grab sample
N02+J - N grab sample &'~
NH 4 - N simulation
N02+3 - N simulation
.·
I
I
\
(I
f I
I I
I I ~I I 8'' \
I
I
( I
• I J I'
I
I
r I ·t
I I
\ ,
0 1 1•
lao
-~
Lj 0
0~~~~~~~~~4r,-~T-r-~r,~~-r-r,_,-~
00.00
04.00
08.00
12.00
16.00
20.00
24.00
Fig 7.24 Alternating nitrification-denitrification. NH4 + and N03- measured o nline, with spot
samples and calculated on model /16/.
262
and VSS have been measured. Fig 7.26 shows the diurnal variations for total and dissolved COD.
The low concentration levels occur because the preprecipitation reduces the COD by
approx. 65 per cent. This also explains the very low content of suspended COD.
The detailed composition of COD in the influent is determined on the basis of the oxygen uptake rate (OUR). The dissolved COD is characterized by means of three fractions: inert, s,, very easily degradable matter, SHAc , and easily degradable matter, S5.
Based on the effluent from the process, dissolved inert COD can be estimated at approx. 10 per cent of the dissolved COD in the influent. The other two fractions are determined by a respiration test.
When determining the fractions in suspended matter, the yield constant observed by
the process is used. The model calculations of this yield constant can be adjusted by
making changes in the inert fraction , X1• In this case it is thus found that the inert particulate COD accounts for 25 per cent of the particulate COD in the influent. The residue of the particulate COD of the influent is assumed to consist of slowly degradable
COD and biomass, that is, Xs, Xe.H and XB,A·
The COD fractions vary in the course of the day, and in Table 7.6 we see the result of
the wastewater characterization as an independent characterization of 8-hour flow-proportional samples has been carried out.