

Treabnent Plants for Denitrification
3
g methanol/m
eM
300
Line for diffusional limitation
Lme forsto1Ch1om/Lc.
-------[,.
[,.
[,.-----£__Connected concentrations,
measured down through the filter
200
0
30
(§d.) in influent at
sN different tests
9.8
6.5
3 . 8 - -
3.5
II
3.0
2.8
~
2.3 ~ Ill
1.8
40
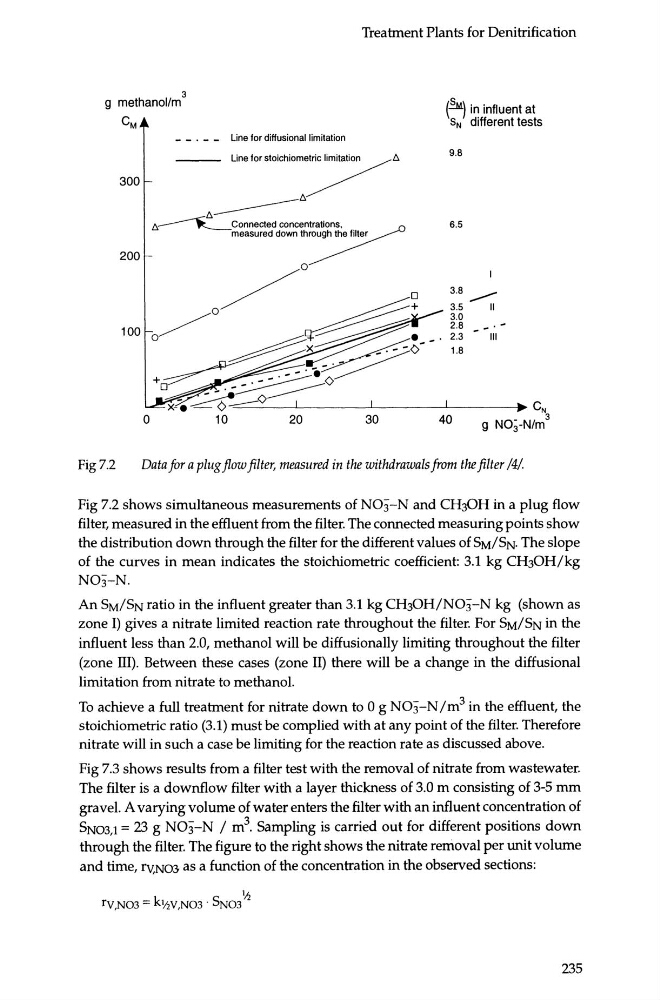
Fig7.2
Data for a plug flow filter, measured in the withdrawals from the filter /4/.
Fig 7.2 shows simultaneous measurements of N03-N and CH30H in a plug flow
filter, measured in the effluent from the filter. The connected measuring points show
the distribution down through the filter for the different values of SMISN. The slope
of the curves in mean indicates the stoichiometric coefficient: 3.1 kg CH30H/kg
N03-N.
An SM/SN ratio in the influent greater than 3.1 kg CH30H/N03-N kg (shown as
zone I) gives a nitrate limited reaction rate throughout the filter. For SMISN in the
influent less than 2.0, methanol will be diffusionally limiting throughout the filter
(zone III). Between these cases (zone II) there will be a change in the diffusional
limitation from nitrate to methanol.
To achieve a full treabnent for nitrate down to 0 g N03-N /m 3 in the effluent, the
stoichiometric ratio (3.1) must be complied with at any point of the filter. Therefore
nitrate will in such a case be limiting for the reaction rate as discussed above.
Fig 7.3 shows results from a filter test with the removal of nitrate from wastewater.
The filter is a downflow filter with a layer thickness of 3.0 m consisting of 3-5 mm
gravel. A varying volume of water enters the filter with an influent concentration of
SNo3,1 = 23 g N03-N I m 3 . Sampling is carried out for different positions down
through the filter. The figure to the right shows the nitrate removal per unit volume
and time, fY,N03 as a function of the concentration in the observed sections:
235
3
g methanol/m
eM
300
Line for diffusional limitation
Lme forsto1Ch1om/Lc.
-------[,.
[,.
[,.-----£__Connected concentrations,
measured down through the filter
200
0
30
(§d.) in influent at
sN different tests
9.8
6.5
3 . 8 - -
3.5
II
3.0
2.8
~
2.3 ~ Ill
1.8
40
Fig7.2
Data for a plug flow filter, measured in the withdrawals from the filter /4/.
Fig 7.2 shows simultaneous measurements of N03-N and CH30H in a plug flow
filter, measured in the effluent from the filter. The connected measuring points show
the distribution down through the filter for the different values of SMISN. The slope
of the curves in mean indicates the stoichiometric coefficient: 3.1 kg CH30H/kg
N03-N.
An SM/SN ratio in the influent greater than 3.1 kg CH30H/N03-N kg (shown as
zone I) gives a nitrate limited reaction rate throughout the filter. For SMISN in the
influent less than 2.0, methanol will be diffusionally limiting throughout the filter
(zone III). Between these cases (zone II) there will be a change in the diffusional
limitation from nitrate to methanol.
To achieve a full treabnent for nitrate down to 0 g N03-N /m 3 in the effluent, the
stoichiometric ratio (3.1) must be complied with at any point of the filter. Therefore
nitrate will in such a case be limiting for the reaction rate as discussed above.
Fig 7.3 shows results from a filter test with the removal of nitrate from wastewater.
The filter is a downflow filter with a layer thickness of 3.0 m consisting of 3-5 mm
gravel. A varying volume of water enters the filter with an influent concentration of
SNo3,1 = 23 g N03-N I m 3 . Sampling is carried out for different positions down
through the filter. The figure to the right shows the nitrate removal per unit volume
and time, fY,N03 as a function of the concentration in the observed sections:
235