

Types of plants, activated sludge plants
1.5
1.4
1.3
1.2
1.1
1.0
0.9
0.8
0.7
0.6
Deviation from
av. airflow
0
24
1/8-1990
48
-model
- activated sludge line 1
.... activated sludge line 2
72
96
120
144
hours
168
192
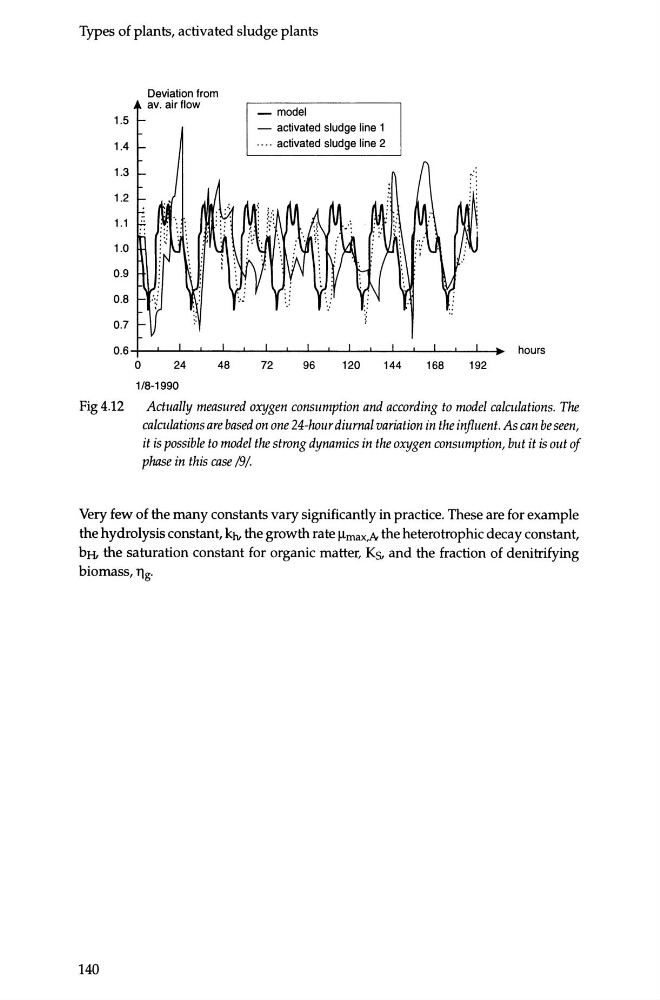
Fig 4.12
Actually measured oxygen consumption and according to model calculations. The
calculations are based on one 24-hour diurnal variation in the influent. As can be seen,
it is possible to model the strong dynamics in the oxygen consumption, but it is out of
phase in this case /9/.
Very few of the many constants vary significantly in practice. These are for example
the hydrolysis constant, k1v the growth rate 1-lmax,Ar the heterotrophic decay constant,
bH, the saturation constant for organic matter, Ks, and the fraction of denitrifying
biomass, llg·
140
1.5
1.4
1.3
1.2
1.1
1.0
0.9
0.8
0.7
0.6
Deviation from
av. airflow
0
24
1/8-1990
48
-model
- activated sludge line 1
.... activated sludge line 2
72
96
120
144
hours
168
192
Fig 4.12
Actually measured oxygen consumption and according to model calculations. The
calculations are based on one 24-hour diurnal variation in the influent. As can be seen,
it is possible to model the strong dynamics in the oxygen consumption, but it is out of
phase in this case /9/.
Very few of the many constants vary significantly in practice. These are for example
the hydrolysis constant, k1v the growth rate 1-lmax,Ar the heterotrophic decay constant,
bH, the saturation constant for organic matter, Ks, and the fraction of denitrifying
biomass, llg·
140