

Wastewater, Volumes and Composition
%of days
100
90
80
70
60
50
40
30
20
10
0
23000 27000
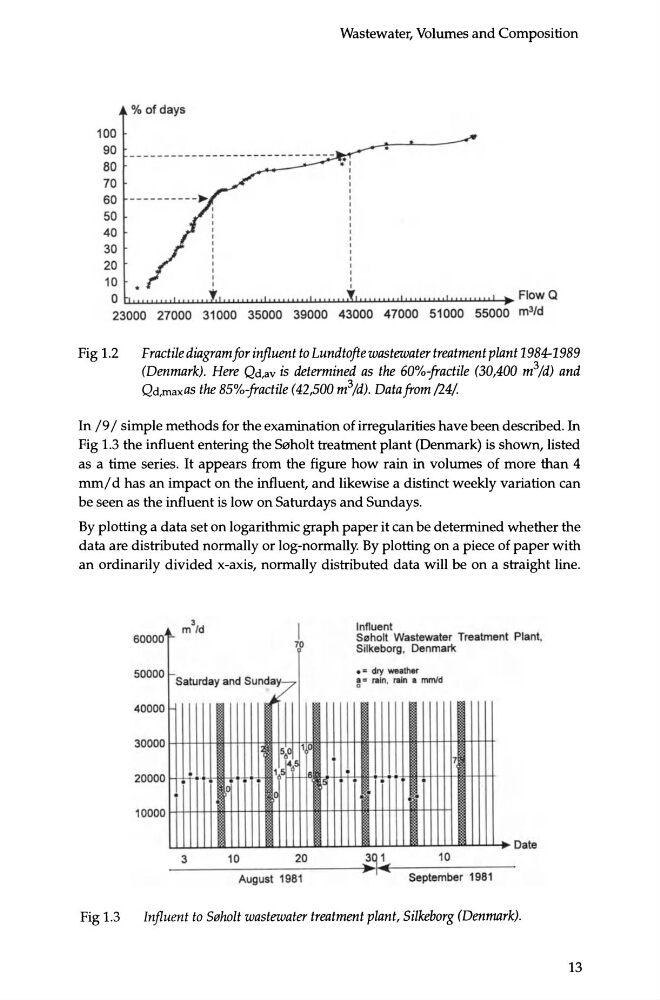
Fig 1.2
Fractile diagram for influent to Lundtofte wastewater treatment plant 1984-1989
(Denmark). Here Qd,av is determined as the 60%-fractile (30,400 m 3 /d) and
Qd,maxas the 85%-fractile (42,500 m 3 /d). Data from /24/.
In /9 I simple methods for the examination of irregularities have been described. In
Fig 1.3 the influent entering the Seholt treatment plant (Denmark) is shown, listed
as a time series. It appears from the figure how rain in volumes of more than 4
mm/ d has an impact on the influent, and likewise a distinct weekly variation can
be seen as the influent is low on Saturdays and Sundays.
By plotting a data set on logarithmic graph paper it can be determined whether the
data are distributed normally or log-normally By plotting on a piece of paper with
an ordinarily divided x-axis, normally distributed data will be on a straight line.
60000
I
70
50000 Saturday and Sunda7
40000
Influent
S111holt Wastewater Treatment Plant,
Silkeborg, Denmark
• a dry we1ther
~ s rain, rain a mmld
30000 H++H~~~t.S~tM~tH+tiH+tHitTHiTIHHtt
7
20000
0
0
oO
u.J....U....I...l.JIIIL..L.J..L..u..JII...Ll....l....l..J...J;;;u..JU-L.J....IIIl...L...I....L.L......, ....... ..L..L......,. ........ .._._., Date
3
10
20
10
August 1981
September 1981
Fig 1.3
Influent to Seholt wastewater treatment plant, Silkeborg (Denmark).
13
%of days
100
90
80
70
60
50
40
30
20
10
0
23000 27000
Fig 1.2
Fractile diagram for influent to Lundtofte wastewater treatment plant 1984-1989
(Denmark). Here Qd,av is determined as the 60%-fractile (30,400 m 3 /d) and
Qd,maxas the 85%-fractile (42,500 m 3 /d). Data from /24/.
In /9 I simple methods for the examination of irregularities have been described. In
Fig 1.3 the influent entering the Seholt treatment plant (Denmark) is shown, listed
as a time series. It appears from the figure how rain in volumes of more than 4
mm/ d has an impact on the influent, and likewise a distinct weekly variation can
be seen as the influent is low on Saturdays and Sundays.
By plotting a data set on logarithmic graph paper it can be determined whether the
data are distributed normally or log-normally By plotting on a piece of paper with
an ordinarily divided x-axis, normally distributed data will be on a straight line.
60000
I
70
50000 Saturday and Sunda7
40000
Influent
S111holt Wastewater Treatment Plant,
Silkeborg, Denmark
• a dry we1ther
~ s rain, rain a mmld
30000 H++H~~~t.S~tM~tH+tiH+tHitTHiTIHHtt
7
20000
0
0
oO
u.J....U....I...l.JIIIL..L.J..L..u..JII...Ll....l....l..J...J;;;u..JU-L.J....IIIl...L...I....L.L......, ....... ..L..L......,. ........ .._._., Date
3
10
20
10
August 1981
September 1981
Fig 1.3
Influent to Seholt wastewater treatment plant, Silkeborg (Denmark).
13