

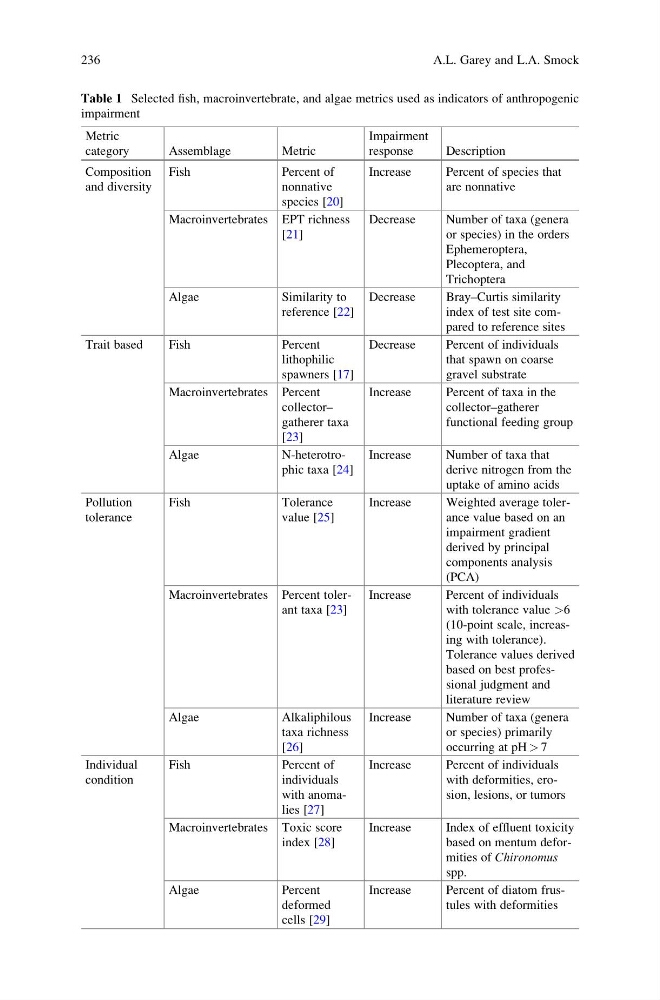
Table 1 Selected fish, macroinvertebrate, and algae metrics used as indicators of anthropogenic
impairment
Metric
category
Assemblage
Metric
Impairment
response
Description
Composition
and diversity
Fish
Percent of
nonnative
species [20]
Increase
Percent of species that
are nonnative
Macroinvertebrates EPT richness
[21]
Decrease
Number of taxa (genera
or species) in the orders
Ephemeroptera,
Plecoptera, and
Trichoptera
Algae
Similarity to
reference [22]
Decrease
Bray–Curtis similarity
index of test site compared to reference sites
Trait based
Fish
Percent
lithophilic
spawners [17]
Decrease
Percent of individuals
that spawn on coarse
gravel substrate
Macroinvertebrates Percent
collector–
gatherer taxa
[23]
Increase
Percent of taxa in the
collector–gatherer
functional feeding group
Algae
N-heterotrophic taxa [24]
Increase
Number of taxa that
derive nitrogen from the
uptake of amino acids
Pollution
tolerance
Fish
Tolerance
value [25]
Increase
Weighted average tolerance value based on an
impairment gradient
derived by principal
components analysis
(PCA)
Macroinvertebrates Percent tolerant taxa [23]
Increase
Percent of individuals
with tolerance value >6
(10-point scale, increasing with tolerance).
Tolerance values derived
based on best professional judgment and
literature review
Algae
Alkaliphilous
taxa richness
[26]
Increase
Number of taxa (genera
or species) primarily
occurring at pH > 7
Individual
condition
Fish
Percent of
individuals
with anomalies [27]
Increase
Percent of individuals
with deformities, erosion, lesions, or tumors
Macroinvertebrates Toxic score
index [28]
Increase
Index of effluent toxicity
based on mentum deformities of Chironomus
spp.
Algae
Percent
deformed
cells [29]
Increase
Percent of diatom frustules with deformities
236
A.L. Garey and L.A. Smock
impairment
Metric
category
Assemblage
Metric
Impairment
response
Description
Composition
and diversity
Fish
Percent of
nonnative
species [20]
Increase
Percent of species that
are nonnative
Macroinvertebrates EPT richness
[21]
Decrease
Number of taxa (genera
or species) in the orders
Ephemeroptera,
Plecoptera, and
Trichoptera
Algae
Similarity to
reference [22]
Decrease
Bray–Curtis similarity
index of test site compared to reference sites
Trait based
Fish
Percent
lithophilic
spawners [17]
Decrease
Percent of individuals
that spawn on coarse
gravel substrate
Macroinvertebrates Percent
collector–
gatherer taxa
[23]
Increase
Percent of taxa in the
collector–gatherer
functional feeding group
Algae
N-heterotrophic taxa [24]
Increase
Number of taxa that
derive nitrogen from the
uptake of amino acids
Pollution
tolerance
Fish
Tolerance
value [25]
Increase
Weighted average tolerance value based on an
impairment gradient
derived by principal
components analysis
(PCA)
Macroinvertebrates Percent tolerant taxa [23]
Increase
Percent of individuals
with tolerance value >6
(10-point scale, increasing with tolerance).
Tolerance values derived
based on best professional judgment and
literature review
Algae
Alkaliphilous
taxa richness
[26]
Increase
Number of taxa (genera
or species) primarily
occurring at pH > 7
Individual
condition
Fish
Percent of
individuals
with anomalies [27]
Increase
Percent of individuals
with deformities, erosion, lesions, or tumors
Macroinvertebrates Toxic score
index [28]
Increase
Index of effluent toxicity
based on mentum deformities of Chironomus
spp.
Algae
Percent
deformed
cells [29]
Increase
Percent of diatom frustules with deformities
236
A.L. Garey and L.A. Smock