

• Cave air temperature at three drip sites
• Dripwater-specific conductance at three drip sites (Fig. 10)
• Dripwater temperature at three drip sites
• Cave stream level at the weir
• Cave air barometric pressure at the weir
Geochemical analyses were conducted for samples collected from 2008 to 2012 for:
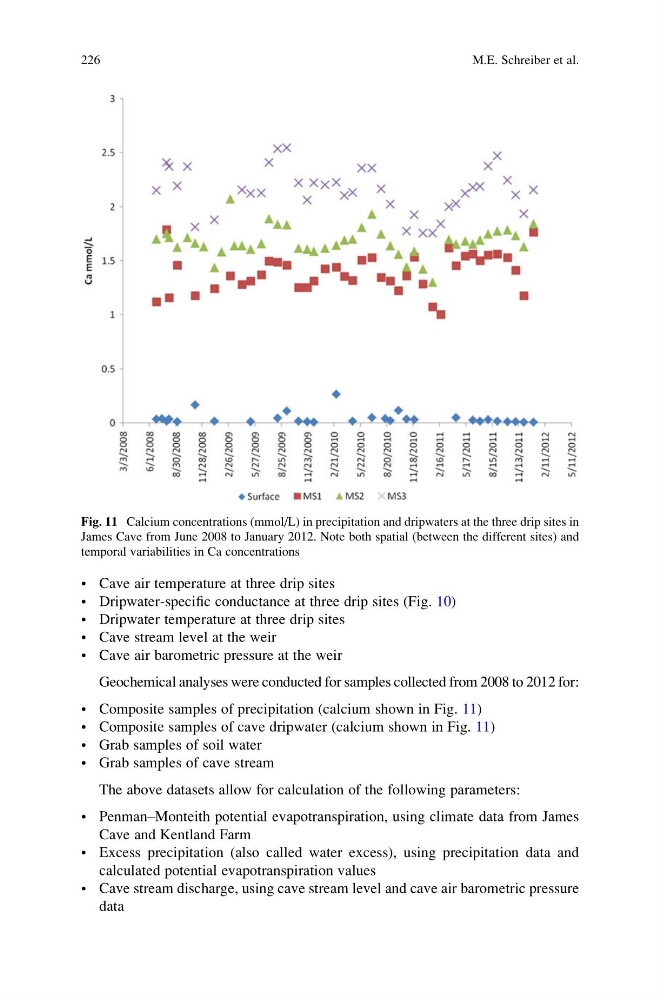
• Composite samples of precipitation (calcium shown in Fig. 11)
• Composite samples of cave dripwater (calcium shown in Fig. 11)
• Grab samples of soil water
• Grab samples of cave stream
The above datasets allow for calculation of the following parameters:
• Penman–Monteith potential evapotranspiration, using climate data from James
Cave and Kentland Farm
• Excess precipitation (also called water excess), using precipitation data and
calculated potential evapotranspiration values
• Cave stream discharge, using cave stream level and cave air barometric pressure
data
Fig. 11 Calcium concentrations (mmol/L) in precipitation and dripwaters at the three drip sites in
James Cave from June 2008 to January 2012. Note both spatial (between the different sites) and
temporal variabilities in Ca concentrations
226
M.E. Schreiber et al.
• Dripwater-specific conductance at three drip sites (Fig. 10)
• Dripwater temperature at three drip sites
• Cave stream level at the weir
• Cave air barometric pressure at the weir
Geochemical analyses were conducted for samples collected from 2008 to 2012 for:
• Composite samples of precipitation (calcium shown in Fig. 11)
• Composite samples of cave dripwater (calcium shown in Fig. 11)
• Grab samples of soil water
• Grab samples of cave stream
The above datasets allow for calculation of the following parameters:
• Penman–Monteith potential evapotranspiration, using climate data from James
Cave and Kentland Farm
• Excess precipitation (also called water excess), using precipitation data and
calculated potential evapotranspiration values
• Cave stream discharge, using cave stream level and cave air barometric pressure
data
Fig. 11 Calcium concentrations (mmol/L) in precipitation and dripwaters at the three drip sites in
James Cave from June 2008 to January 2012. Note both spatial (between the different sites) and
temporal variabilities in Ca concentrations
226
M.E. Schreiber et al.