

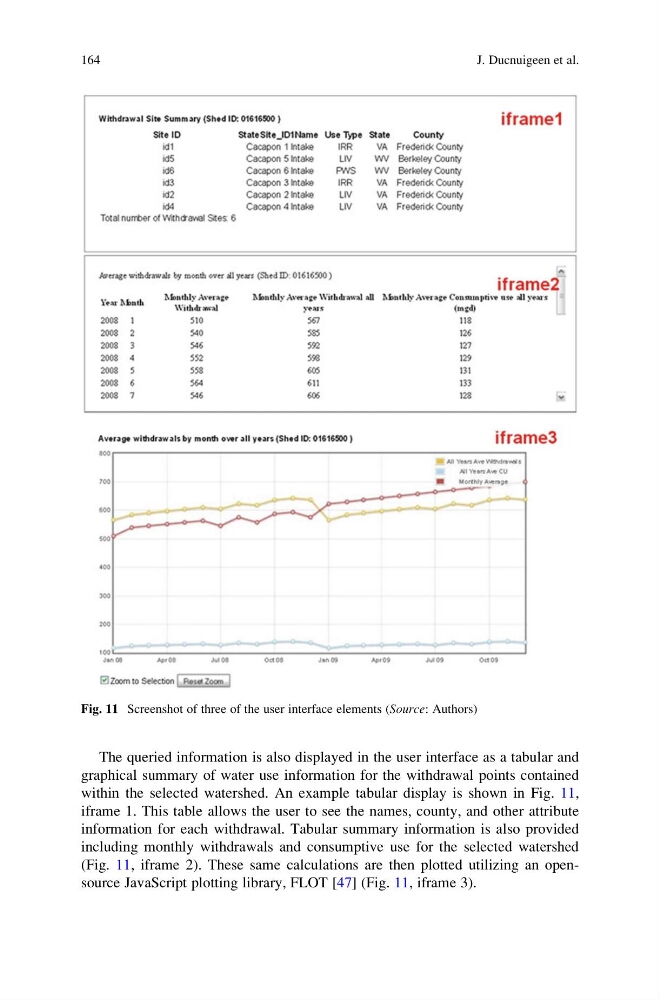
The queried information is also displayed in the user interface as a tabular and
graphical summary of water use information for the withdrawal points contained
within the selected watershed. An example tabular display is shown in Fig. 11,
iframe 1. This table allows the user to see the names, county, and other attribute
information for each withdrawal. Tabular summary information is also provided
including monthly withdrawals and consumptive use for the selected watershed
(Fig. 11, iframe 2). These same calculations are then plotted utilizing an opensource JavaScript plotting library, FLOT [47] (Fig. 11, iframe 3).
Fig. 11 Screenshot of three of the user interface elements (Source: Authors)
164
J. Ducnuigeen et al.
graphical summary of water use information for the withdrawal points contained
within the selected watershed. An example tabular display is shown in Fig. 11,
iframe 1. This table allows the user to see the names, county, and other attribute
information for each withdrawal. Tabular summary information is also provided
including monthly withdrawals and consumptive use for the selected watershed
(Fig. 11, iframe 2). These same calculations are then plotted utilizing an opensource JavaScript plotting library, FLOT [47] (Fig. 11, iframe 3).
Fig. 11 Screenshot of three of the user interface elements (Source: Authors)
164
J. Ducnuigeen et al.