

4.3 Prototype Version of Mapping Tool
A desktop prototype version of the interactive mapping tool was constructed to test
methods for developing an Internet browser-based mapping application and
backend relational database to hold and display withdrawal data and consumptive
use estimates. In this prototype, sample data were used and onsite return flows were
assumed for all withdrawals. Development of the tool has provided an opportunity
to better understand the complexities of web-based interactive architectures and
lays the groundwork for developing a more advanced tool to incorporate the full
Water Balance Conveyance Model.
The tool provides the user with summary cumulative upstream withdrawal data
and consumptive use estimates. Therefore, the system must be able to uniquely
identify the watershed within which the user has clicked and the withdrawal points
contained only within that selected watershed. When the user first loads the map
user interface, OpenLayers, in a web browser, the watersheds and withdrawal point
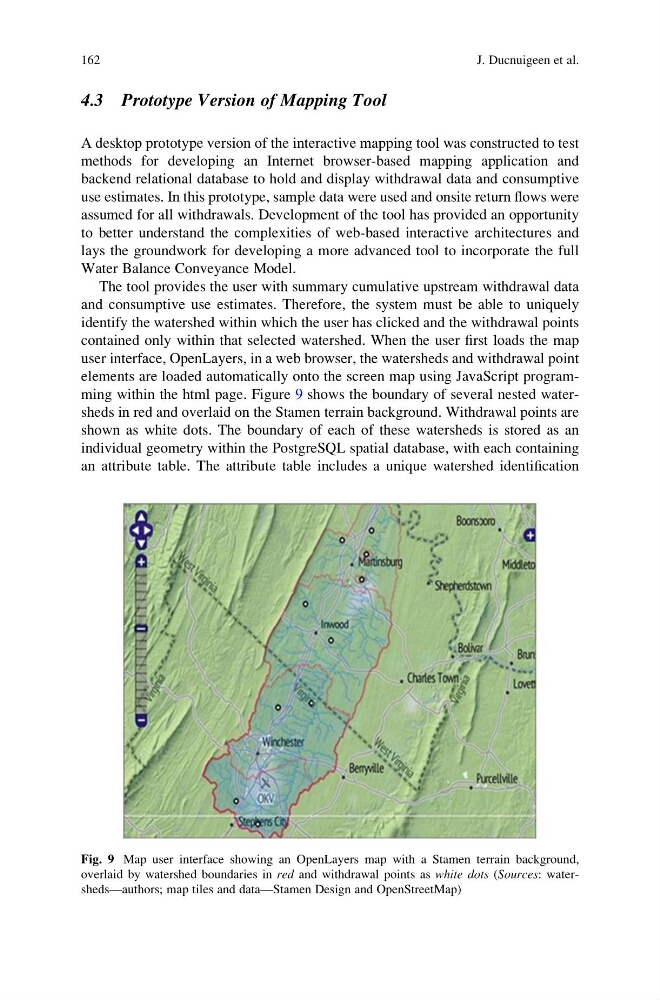
elements are loaded automatically onto the screen map using JavaScript programming within the html page. Figure 9 shows the boundary of several nested watersheds in red and overlaid on the Stamen terrain background. Withdrawal points are
shown as white dots. The boundary of each of these watersheds is stored as an
individual geometry within the PostgreSQL spatial database, with each containing
an attribute table. The attribute table includes a unique watershed identification
Fig. 9 Map user interface showing an OpenLayers map with a Stamen terrain background,
overlaid by watershed boundaries in red and withdrawal points as white dots (Sources: watersheds—authors; map tiles and data—Stamen Design and OpenStreetMap)
162
J. Ducnuigeen et al.
A desktop prototype version of the interactive mapping tool was constructed to test
methods for developing an Internet browser-based mapping application and
backend relational database to hold and display withdrawal data and consumptive
use estimates. In this prototype, sample data were used and onsite return flows were
assumed for all withdrawals. Development of the tool has provided an opportunity
to better understand the complexities of web-based interactive architectures and
lays the groundwork for developing a more advanced tool to incorporate the full
Water Balance Conveyance Model.
The tool provides the user with summary cumulative upstream withdrawal data
and consumptive use estimates. Therefore, the system must be able to uniquely
identify the watershed within which the user has clicked and the withdrawal points
contained only within that selected watershed. When the user first loads the map
user interface, OpenLayers, in a web browser, the watersheds and withdrawal point
elements are loaded automatically onto the screen map using JavaScript programming within the html page. Figure 9 shows the boundary of several nested watersheds in red and overlaid on the Stamen terrain background. Withdrawal points are
shown as white dots. The boundary of each of these watersheds is stored as an
individual geometry within the PostgreSQL spatial database, with each containing
an attribute table. The attribute table includes a unique watershed identification
Fig. 9 Map user interface showing an OpenLayers map with a Stamen terrain background,
overlaid by watershed boundaries in red and withdrawal points as white dots (Sources: watersheds—authors; map tiles and data—Stamen Design and OpenStreetMap)
162
J. Ducnuigeen et al.