

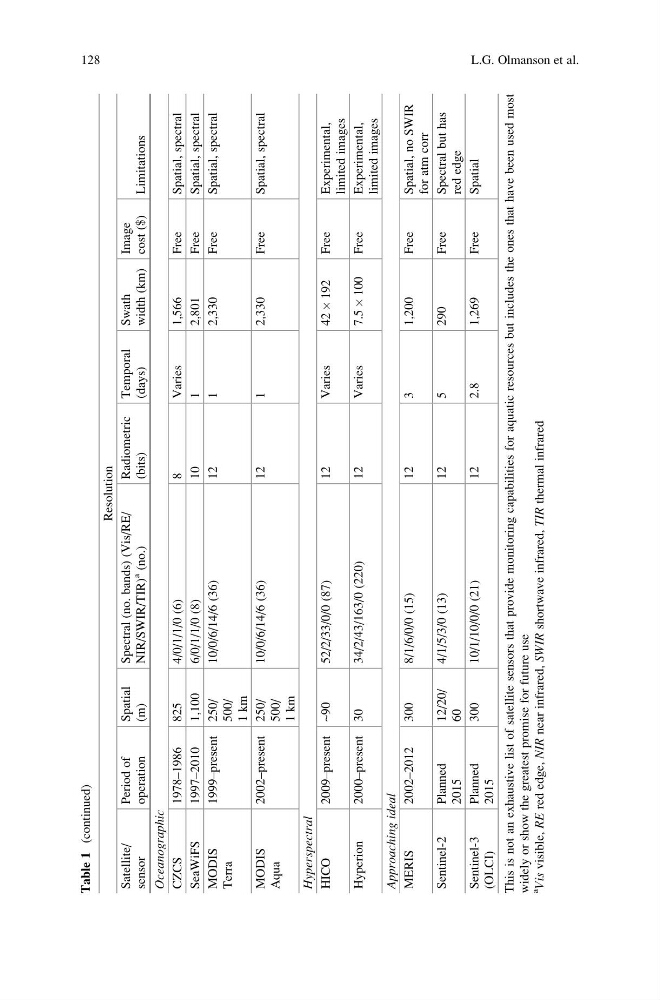
Table 1 (continued)
Resolution
Satellite/
sensor
Period of
operation
Spatial
(m)
Spectral (no. bands) (Vis/RE/
NIR/SWIR/TIR)
a
(no.)
Radiometric
(bits)
Temporal
(days)
Swath
width (km)
Image
cost ($)
Limitations
Oceanographic
CZCS
1978–1986
825
4/0/1/1/0 (6)
8
Varies
1,566
Free
Spatial, spectral
SeaWiFS
1997–2010
1,100
6/0/1/1/0 (8)
10
1
2,801
Free
Spatial, spectral
MODIS
Terra
1999–present 250/
500/
1 km
10/0/6/14/6 (36)
12
1
2,330
Free
Spatial, spectral
MODIS
Aqua
2002–present 250/
500/
1 km
10/0/6/14/6 (36)
12
1
2,330
Free
Spatial, spectral
Hyperspectral
HICO
2009–present ~90
52/2/33/0/0 (87)
12
Varies
42
 192
Free
Experimental,
limited images
Hyperion
2000–present 30
34/2/43/163/0 (220)
12
Varies
7.5
 100
Free
Experimental,
limited images
Approaching ideal
MERIS
2002–2012
300
8/1/6/0/0 (15)
12
3
1,200
Free
Spatial, no SWIR
for atm corr
Sentinel-2
Planned
2015
12/20/
60
4/1/5/3/0 (13)
12
5
290
Free
Spectral but has
red edge
Sentinel-3
(OLCI)
Planned
2015
300
10/1/10/0/0 (21)
12
2.8
1,269
Free
Spatial
This is not an exhaustive list of satellite sensors that provide monitoring capabilities for aquatic resources but includes the ones that have been used most
widely or show the greatest promise for future use
a
Vis visible,
RE red edge,
NIR near infrared,
SWIR shortwave infrared,
TIR thermal infrared
128
L.G. Olmanson et al.
Resolution
Satellite/
sensor
Period of
operation
Spatial
(m)
Spectral (no. bands) (Vis/RE/
NIR/SWIR/TIR)
a
(no.)
Radiometric
(bits)
Temporal
(days)
Swath
width (km)
Image
cost ($)
Limitations
Oceanographic
CZCS
1978–1986
825
4/0/1/1/0 (6)
8
Varies
1,566
Free
Spatial, spectral
SeaWiFS
1997–2010
1,100
6/0/1/1/0 (8)
10
1
2,801
Free
Spatial, spectral
MODIS
Terra
1999–present 250/
500/
1 km
10/0/6/14/6 (36)
12
1
2,330
Free
Spatial, spectral
MODIS
Aqua
2002–present 250/
500/
1 km
10/0/6/14/6 (36)
12
1
2,330
Free
Spatial, spectral
Hyperspectral
HICO
2009–present ~90
52/2/33/0/0 (87)
12
Varies
42
 192
Free
Experimental,
limited images
Hyperion
2000–present 30
34/2/43/163/0 (220)
12
Varies
7.5
 100
Free
Experimental,
limited images
Approaching ideal
MERIS
2002–2012
300
8/1/6/0/0 (15)
12
3
1,200
Free
Spatial, no SWIR
for atm corr
Sentinel-2
Planned
2015
12/20/
60
4/1/5/3/0 (13)
12
5
290
Free
Spectral but has
red edge
Sentinel-3
(OLCI)
Planned
2015
300
10/1/10/0/0 (21)
12
2.8
1,269
Free
Spatial
This is not an exhaustive list of satellite sensors that provide monitoring capabilities for aquatic resources but includes the ones that have been used most
widely or show the greatest promise for future use
a
Vis visible,
RE red edge,
NIR near infrared,
SWIR shortwave infrared,
TIR thermal infrared
128
L.G. Olmanson et al.