

Taihu Bay), has resulted in eutrophication and water supply problems and a
reduction in the flood control capabilities of the Lake Taihu system [41].
Remote sensing is an effective tool for assessing land cover change in the
watershed [36, 43]. In this study, multi-temporal (yearly) land cover maps were
NDAVI (2000)
a
NDAVI (2010)
b
Chl-a (2000)
c
Chl-a (2010)
d
-0.6
-0.4
-0.2
0.0
0.2
0.4
0.6
Mar
Apr May Jun
Jul
Aug Sep
Oct
Nov
Open water
Algal bloom
Submerged macrophytes
Floating macrophytes
Emergent vegetation
-0.6
-0.4
-0.2
0.0
0.2
0.4
0.6
Mar Apr May Jun Jul
Jul Aug Sep Oct Nov
Open water
Algal bloom
Submerged macrophytes
Floating macrophytes
Emergent vegetation
0.0
0.1
0.2
0.3
0.4
0.5
0.6
Mar
Apr
May Jun
Jul
Aug Sep
Oct
Nov
Open water
Algal bloom
Submerged macrophytes
Floating macrophytes
Emergent vegetation
0.0
0.1
0.2
0.3
0.4
0.5
0.6
Mar Apr May Jun Jul
Jul Aug Sep Oct Nov
Open water
Algal bloom
Submerged macrophytes
Floating macrophytes
Emergent vegetation
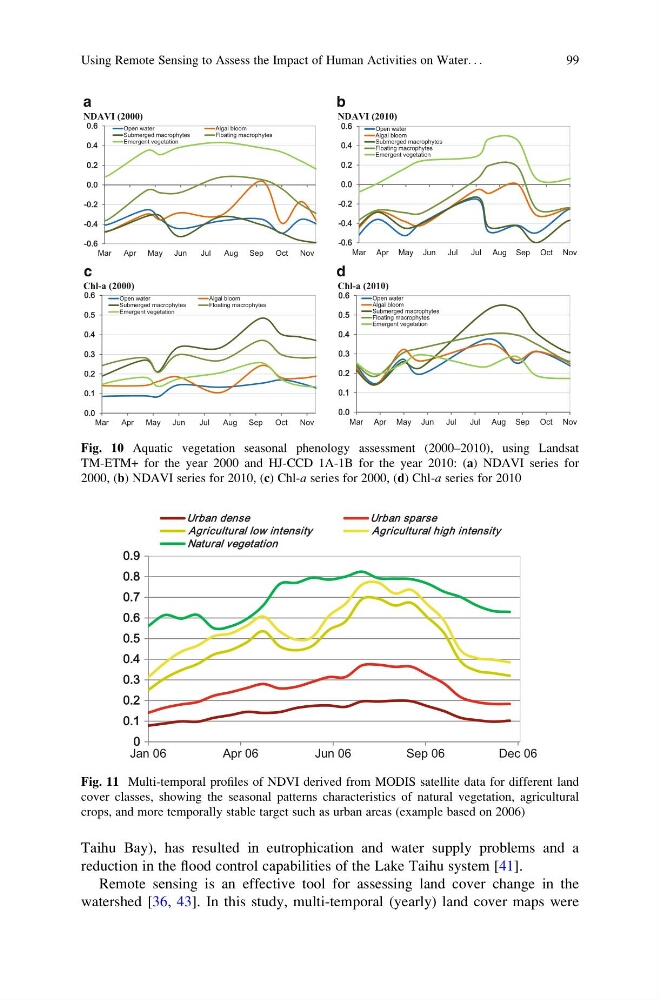
Fig. 10 Aquatic vegetation seasonal phenology assessment (2000–2010), using Landsat
TM-ETM+ for the year 2000 and HJ-CCD 1A-1B for the year 2010: (a) NDAVI series for
2000, (b) NDAVI series for 2010, (c) Chl-a series for 2000, (d) Chl-a series for 2010
0
0.1
0.2
0.3
0.4
0.5
0.6
0.7
0.8
0.9
Jan 06
Apr 06
Jun 06
Sep 06
Dec 06
Urban dense
Urban sparse
Agricultural low intensity
Agricultural high intensity
Natural vegetation
Fig. 11 Multi-temporal profiles of NDVI derived from MODIS satellite data for different land
cover classes, showing the seasonal patterns characteristics of natural vegetation, agricultural
crops, and more temporally stable target such as urban areas (example based on 2006)
Using Remote Sensing to Assess the Impact of Human Activities on Water. . .
99
reduction in the flood control capabilities of the Lake Taihu system [41].
Remote sensing is an effective tool for assessing land cover change in the
watershed [36, 43]. In this study, multi-temporal (yearly) land cover maps were
NDAVI (2000)
a
NDAVI (2010)
b
Chl-a (2000)
c
Chl-a (2010)
d
-0.6
-0.4
-0.2
0.0
0.2
0.4
0.6
Mar
Apr May Jun
Jul
Aug Sep
Oct
Nov
Open water
Algal bloom
Submerged macrophytes
Floating macrophytes
Emergent vegetation
-0.6
-0.4
-0.2
0.0
0.2
0.4
0.6
Mar Apr May Jun Jul
Jul Aug Sep Oct Nov
Open water
Algal bloom
Submerged macrophytes
Floating macrophytes
Emergent vegetation
0.0
0.1
0.2
0.3
0.4
0.5
0.6
Mar
Apr
May Jun
Jul
Aug Sep
Oct
Nov
Open water
Algal bloom
Submerged macrophytes
Floating macrophytes
Emergent vegetation
0.0
0.1
0.2
0.3
0.4
0.5
0.6
Mar Apr May Jun Jul
Jul Aug Sep Oct Nov
Open water
Algal bloom
Submerged macrophytes
Floating macrophytes
Emergent vegetation
Fig. 10 Aquatic vegetation seasonal phenology assessment (2000–2010), using Landsat
TM-ETM+ for the year 2000 and HJ-CCD 1A-1B for the year 2010: (a) NDAVI series for
2000, (b) NDAVI series for 2010, (c) Chl-a series for 2000, (d) Chl-a series for 2010
0
0.1
0.2
0.3
0.4
0.5
0.6
0.7
0.8
0.9
Jan 06
Apr 06
Jun 06
Sep 06
Dec 06
Urban dense
Urban sparse
Agricultural low intensity
Agricultural high intensity
Natural vegetation
Fig. 11 Multi-temporal profiles of NDVI derived from MODIS satellite data for different land
cover classes, showing the seasonal patterns characteristics of natural vegetation, agricultural
crops, and more temporally stable target such as urban areas (example based on 2006)
Using Remote Sensing to Assess the Impact of Human Activities on Water. . .
99