

covering the period 2000–2013, specifically Landsat TM-ETM+, HJ-CCD 1A-B,
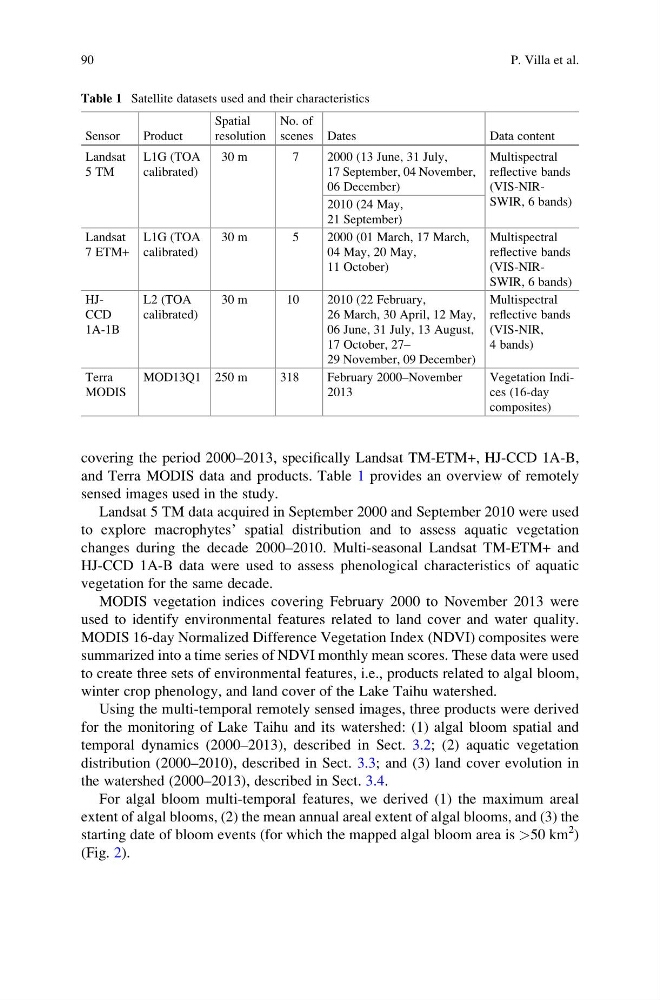
and Terra MODIS data and products. Table 1 provides an overview of remotely
sensed images used in the study.
Landsat 5 TM data acquired in September 2000 and September 2010 were used
to explore macrophytes’ spatial distribution and to assess aquatic vegetation
changes during the decade 2000–2010. Multi-seasonal Landsat TM-ETM+ and
HJ-CCD 1A-B data were used to assess phenological characteristics of aquatic
vegetation for the same decade.
MODIS vegetation indices covering February 2000 to November 2013 were
used to identify environmental features related to land cover and water quality.
MODIS 16-day Normalized Difference Vegetation Index (NDVI) composites were
summarized into a time series of NDVI monthly mean scores. These data were used
to create three sets of environmental features, i.e., products related to algal bloom,
winter crop phenology, and land cover of the Lake Taihu watershed.
Using the multi-temporal remotely sensed images, three products were derived
for the monitoring of Lake Taihu and its watershed: (1) algal bloom spatial and
temporal dynamics (2000–2013), described in Sect. 3.2; (2) aquatic vegetation
distribution (2000–2010), described in Sect. 3.3; and (3) land cover evolution in
the watershed (2000–2013), described in Sect. 3.4.
For algal bloom multi-temporal features, we derived (1) the maximum areal
extent of algal blooms, (2) the mean annual areal extent of algal blooms, and (3) the
starting date of bloom events (for which the mapped algal bloom area is >50 km
2 )
(Fig. 2).
Table 1 Satellite datasets used and their characteristics
Sensor
Product
Spatial
resolution
No. of
scenes Dates
Data content
Landsat
5 TM
L1G (TOA
calibrated)
30 m
7
2000 (13 June, 31 July,
17 September, 04 November,
06 December)
Multispectral
reflective bands
(VIS-NIRSWIR, 6 bands)
2010 (24 May,
21 September)
Landsat
7 ETM+
L1G (TOA
calibrated)
30 m
5
2000 (01 March, 17 March,
04 May, 20 May,
11 October)
Multispectral
reflective bands
(VIS-NIRSWIR, 6 bands)
HJCCD
1A-1B
L2 (TOA
calibrated)
30 m
10
2010 (22 February,
26 March, 30 April, 12 May,
06 June, 31 July, 13 August,
17 October, 27–
29 November, 09 December)
Multispectral
reflective bands
(VIS-NIR,
4 bands)
Terra
MODIS
MOD13Q1 250 m
318
February 2000–November
2013
Vegetation Indices (16-day
composites)
90
P. Villa et al.
and Terra MODIS data and products. Table 1 provides an overview of remotely
sensed images used in the study.
Landsat 5 TM data acquired in September 2000 and September 2010 were used
to explore macrophytes’ spatial distribution and to assess aquatic vegetation
changes during the decade 2000–2010. Multi-seasonal Landsat TM-ETM+ and
HJ-CCD 1A-B data were used to assess phenological characteristics of aquatic
vegetation for the same decade.
MODIS vegetation indices covering February 2000 to November 2013 were
used to identify environmental features related to land cover and water quality.
MODIS 16-day Normalized Difference Vegetation Index (NDVI) composites were
summarized into a time series of NDVI monthly mean scores. These data were used
to create three sets of environmental features, i.e., products related to algal bloom,
winter crop phenology, and land cover of the Lake Taihu watershed.
Using the multi-temporal remotely sensed images, three products were derived
for the monitoring of Lake Taihu and its watershed: (1) algal bloom spatial and
temporal dynamics (2000–2013), described in Sect. 3.2; (2) aquatic vegetation
distribution (2000–2010), described in Sect. 3.3; and (3) land cover evolution in
the watershed (2000–2013), described in Sect. 3.4.
For algal bloom multi-temporal features, we derived (1) the maximum areal
extent of algal blooms, (2) the mean annual areal extent of algal blooms, and (3) the
starting date of bloom events (for which the mapped algal bloom area is >50 km
2 )
(Fig. 2).
Table 1 Satellite datasets used and their characteristics
Sensor
Product
Spatial
resolution
No. of
scenes Dates
Data content
Landsat
5 TM
L1G (TOA
calibrated)
30 m
7
2000 (13 June, 31 July,
17 September, 04 November,
06 December)
Multispectral
reflective bands
(VIS-NIRSWIR, 6 bands)
2010 (24 May,
21 September)
Landsat
7 ETM+
L1G (TOA
calibrated)
30 m
5
2000 (01 March, 17 March,
04 May, 20 May,
11 October)
Multispectral
reflective bands
(VIS-NIRSWIR, 6 bands)
HJCCD
1A-1B
L2 (TOA
calibrated)
30 m
10
2010 (22 February,
26 March, 30 April, 12 May,
06 June, 31 July, 13 August,
17 October, 27–
29 November, 09 December)
Multispectral
reflective bands
(VIS-NIR,
4 bands)
Terra
MODIS
MOD13Q1 250 m
318
February 2000–November
2013
Vegetation Indices (16-day
composites)
90
P. Villa et al.